Note: the new project Atomized/Retroffited Functioning by fabric | ch has been selected for La Biennale di Venezia / 19th International Architecture Exhibition (2025), curated by C. Ratti.
The piece is currently on display in the Corderie (main exhibition space of the Arsenale, Venice) and will stay exhibited until the 23rd of November 2025 (10.05 – 23.11.2025).
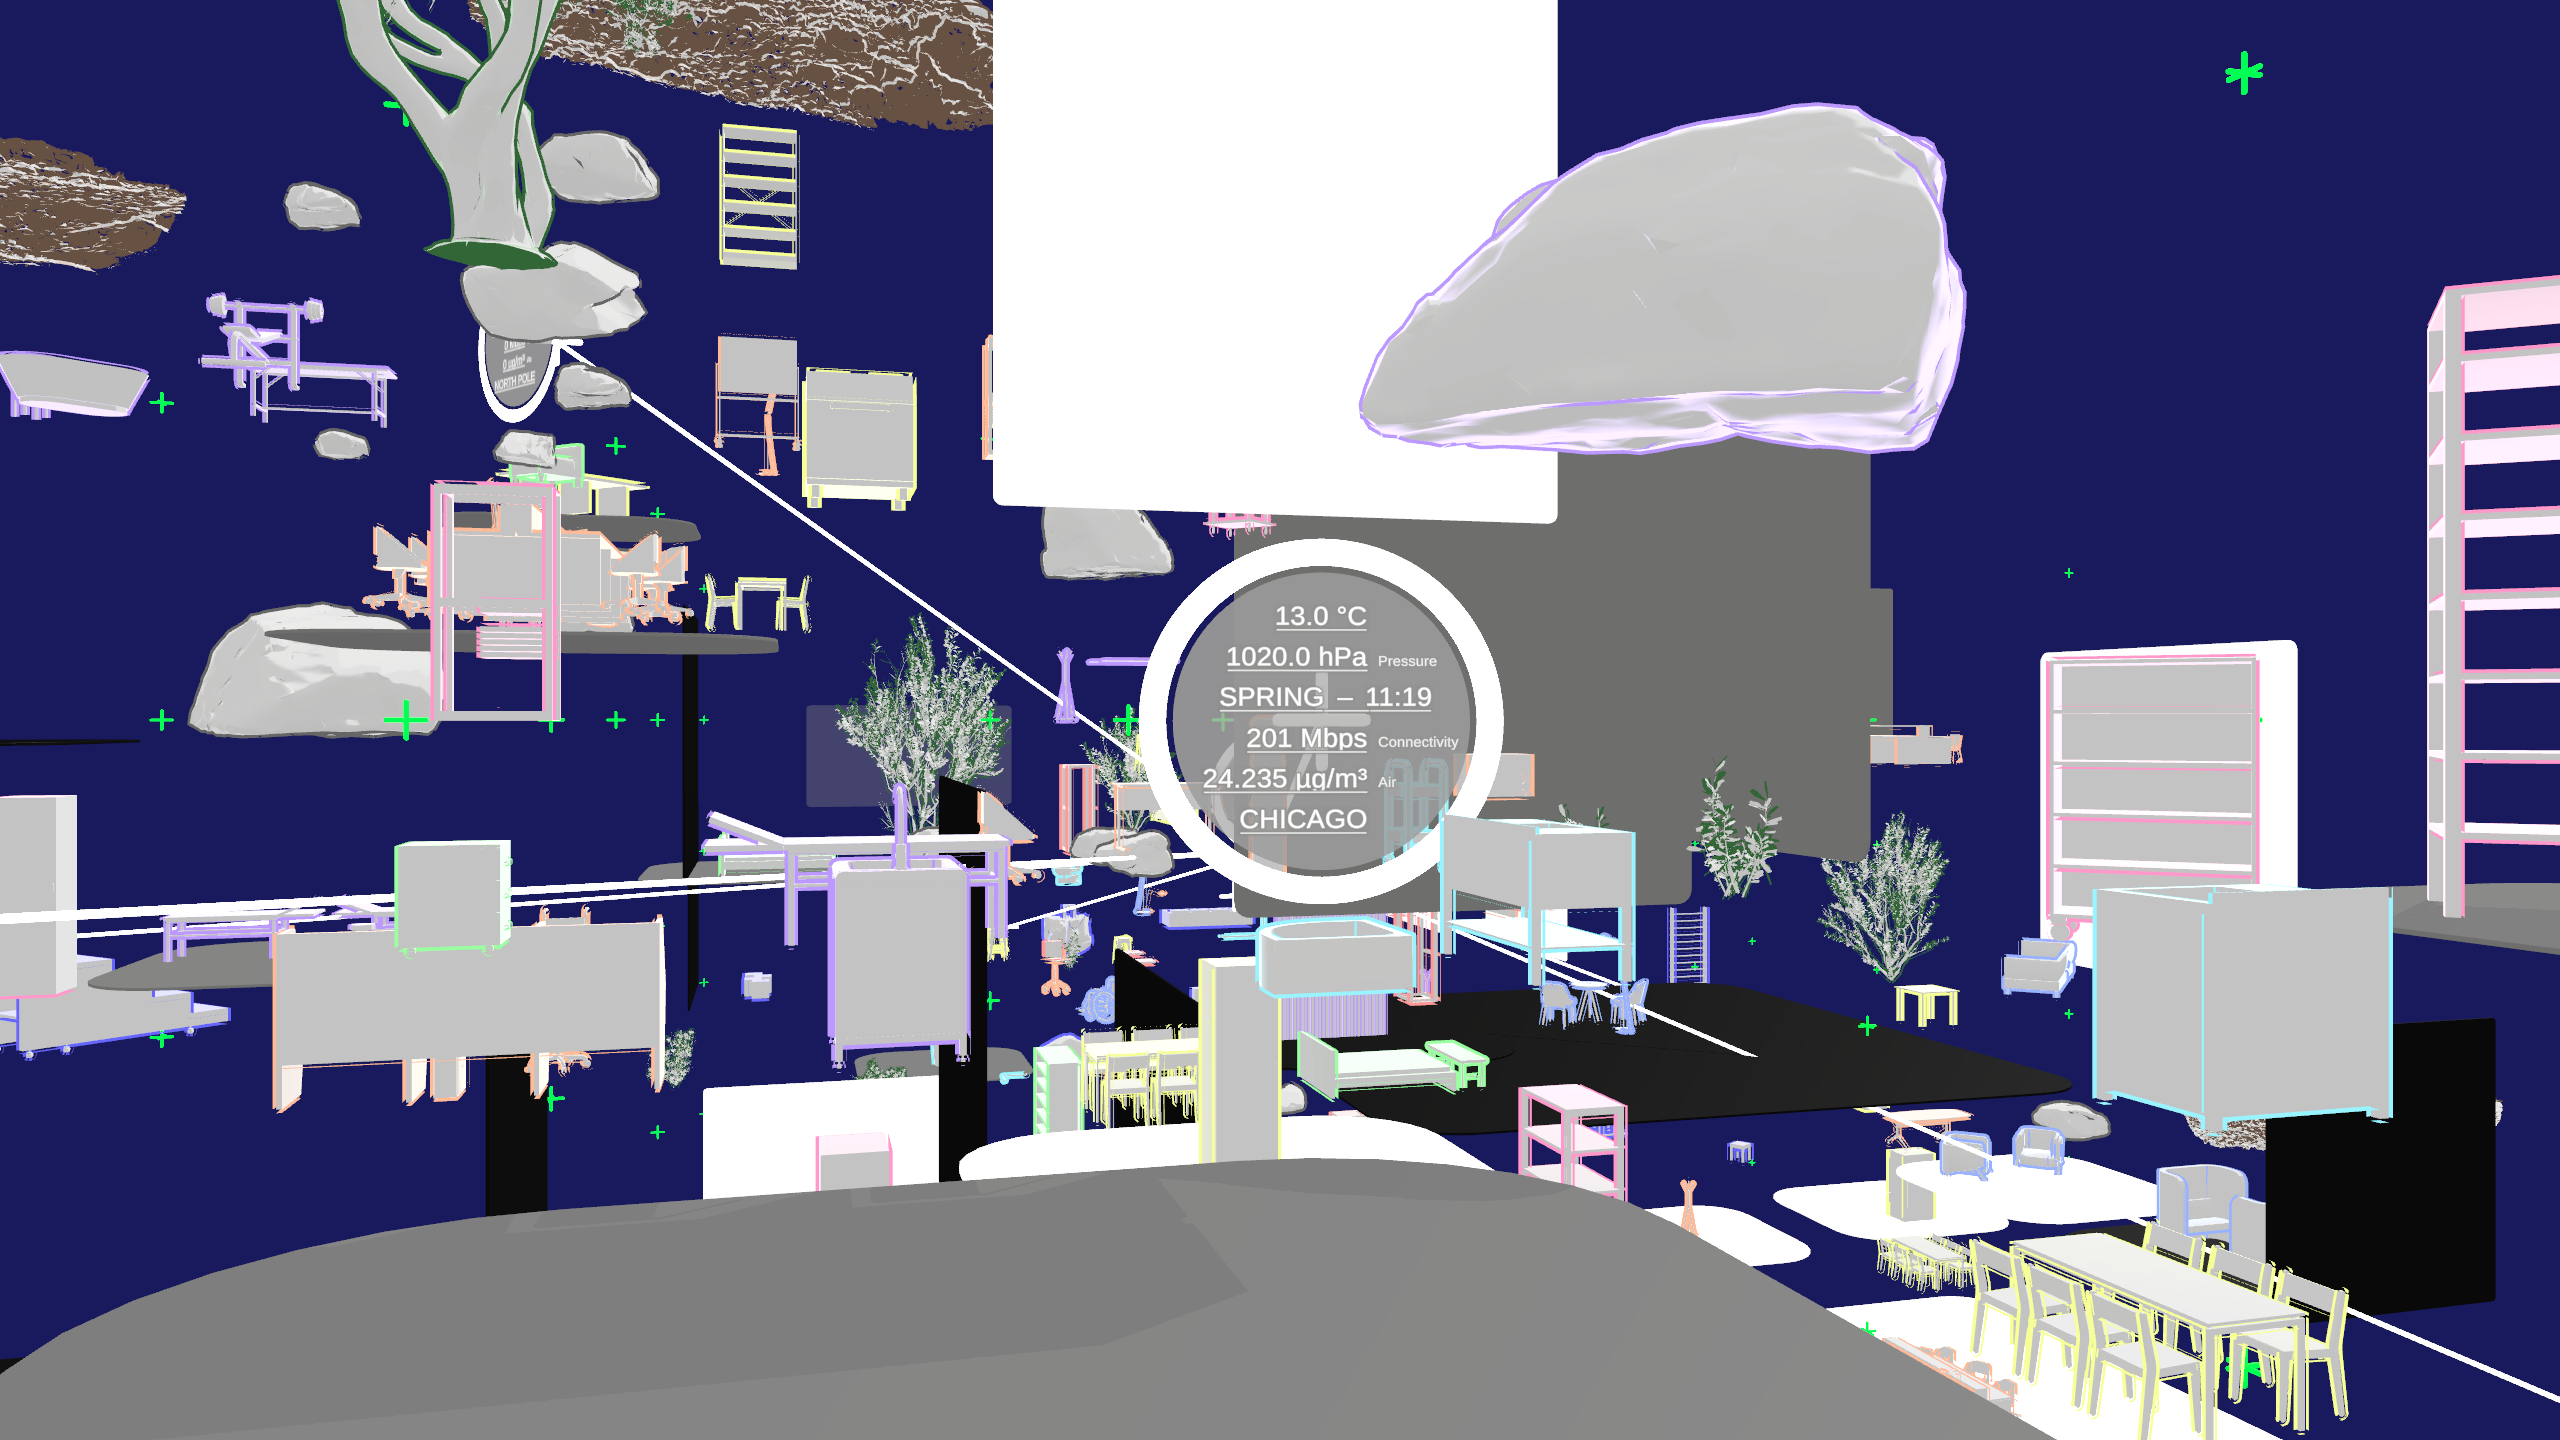
The project present a live iteration of the ongoing Atomized (*) series of work, at this occasion within a fictional space that gather dynamic planetary conditions, in the form of environmental data coming from meteo stations across the globe.
This is a series of radical algorithmic experiments that fabric | ch discreetly initiated in 2014 with a publication—Desierto #3, 28°C—, and an experimental project—Reponsive Atmospheric Patios—on “spatial and environmental intelligence”: real-time environmental data feeds into the automated and continuous assembly of previously “atomized” elements of architectural functions (as well as a diverse set of “atoms” of use/misuse/non-use of space). The results help us to study renewed and evolving assemblies for our changing planet.
...
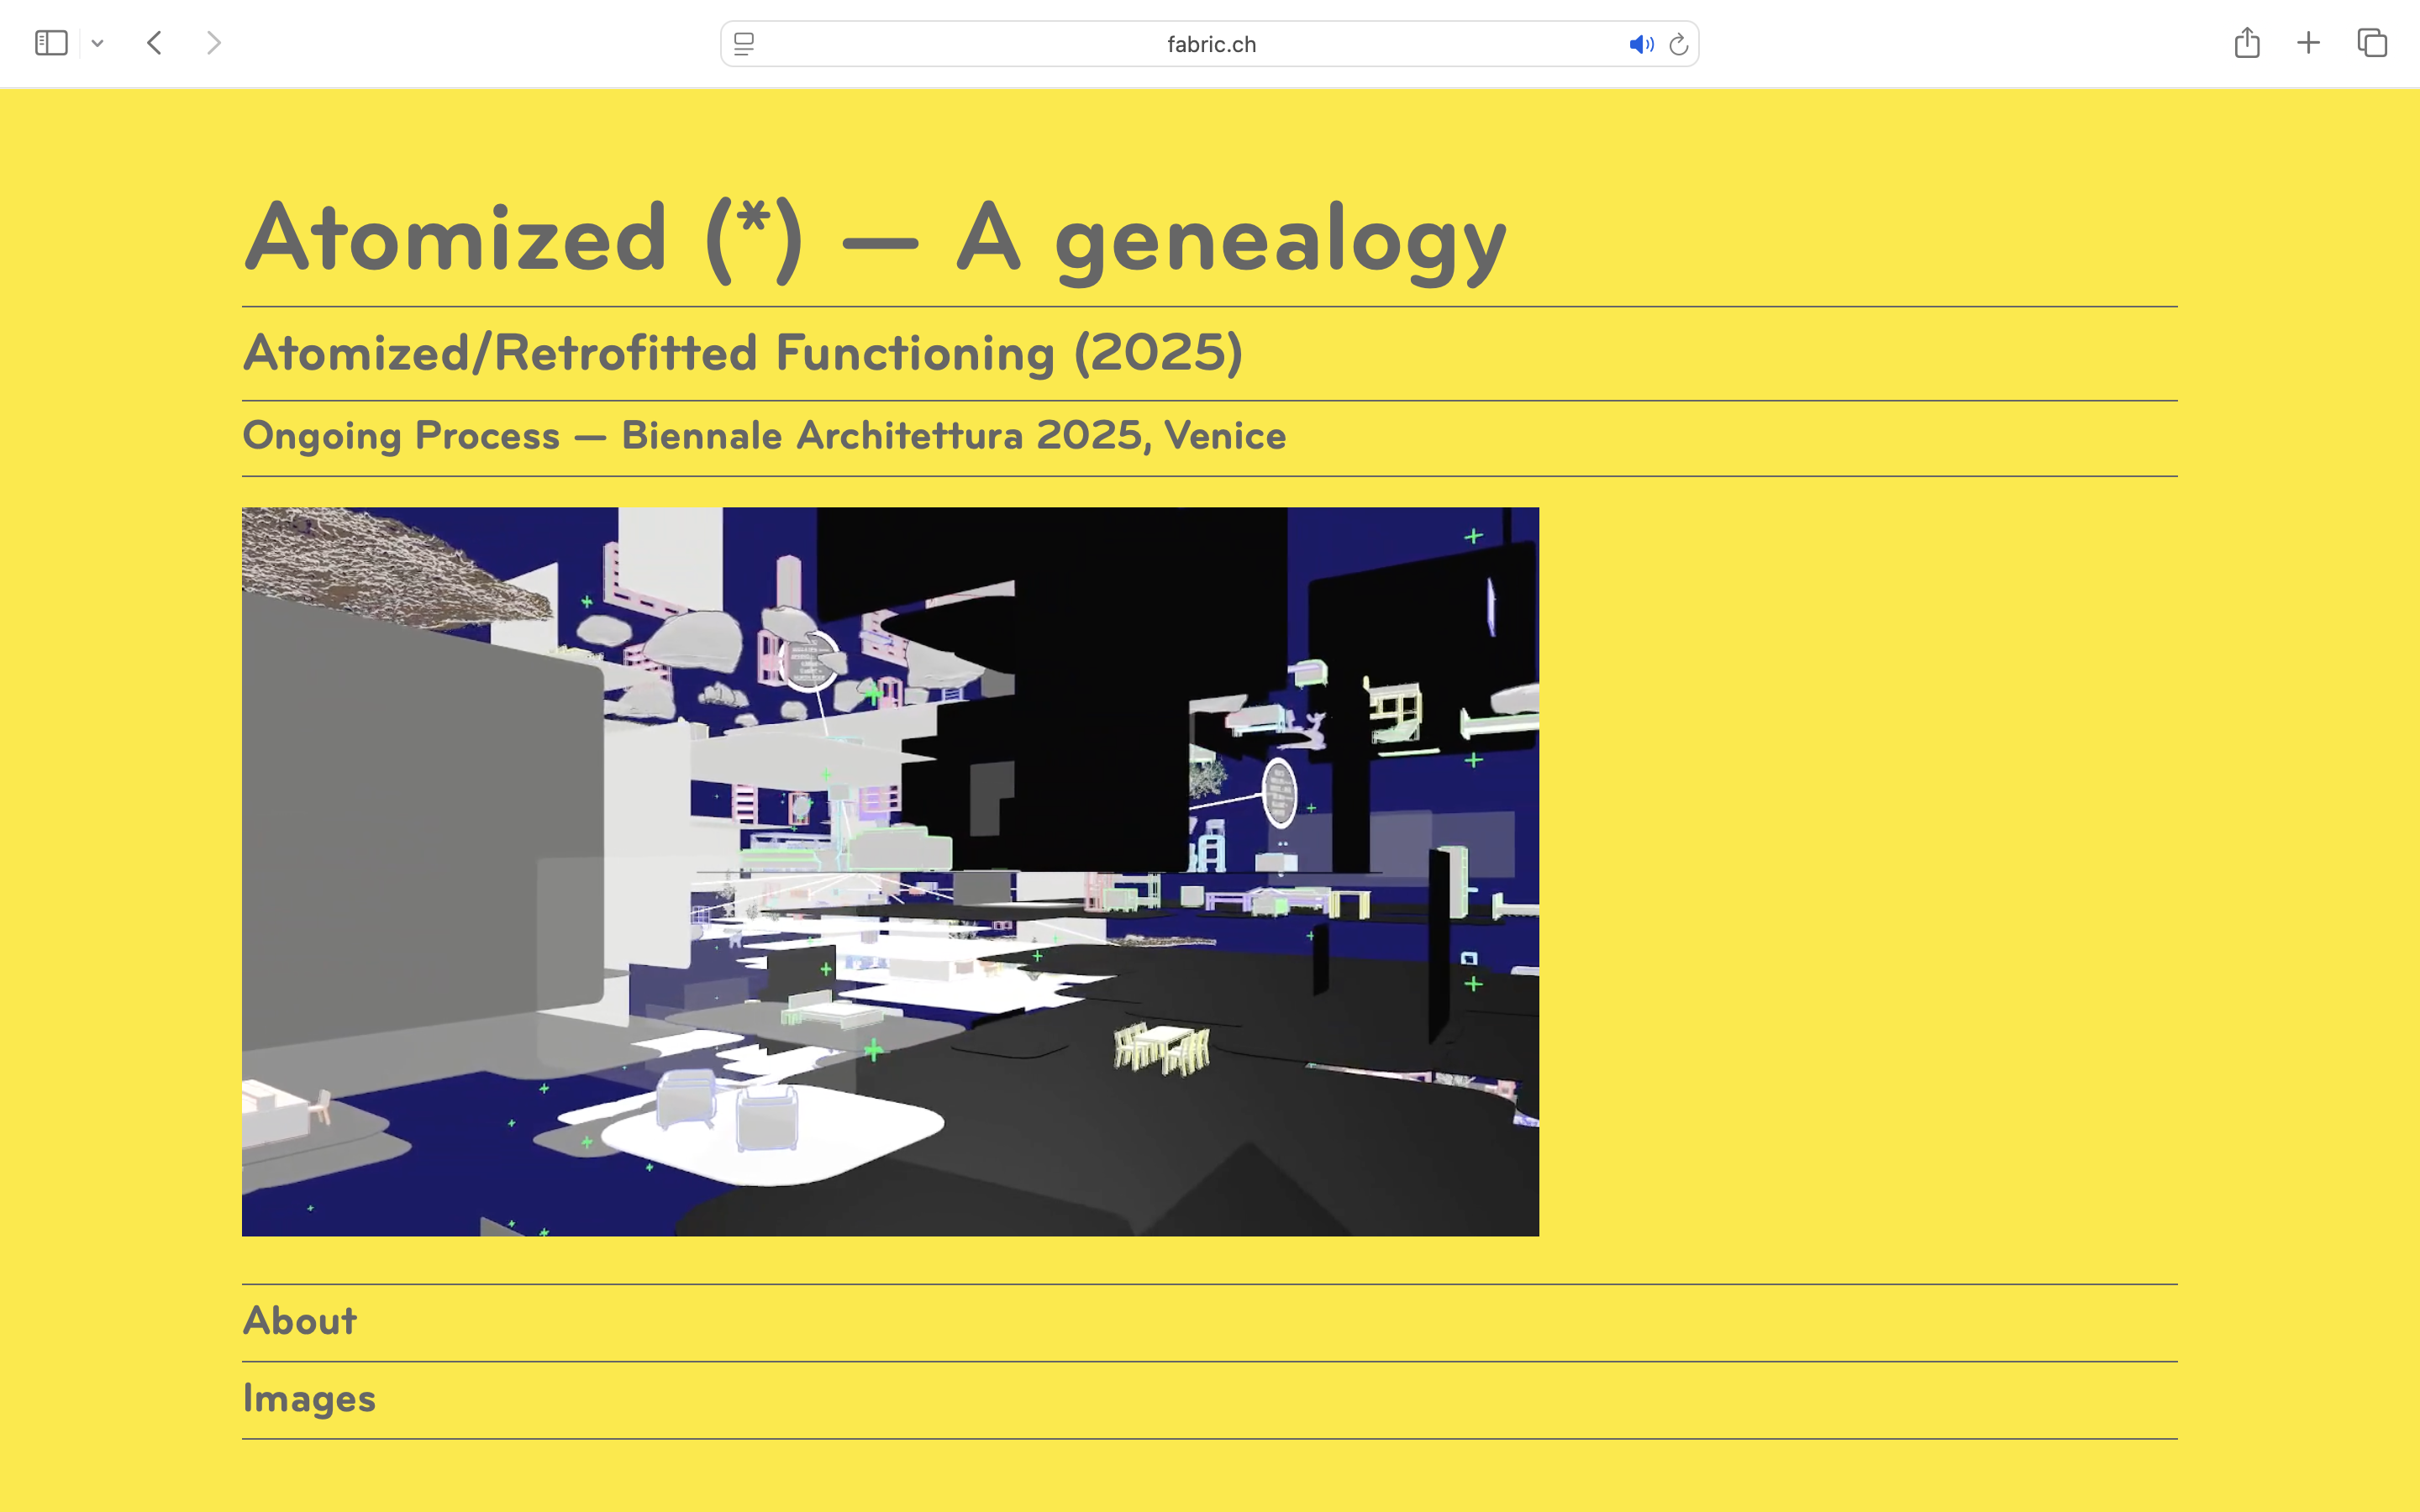
The whole project, its genealogy, and the current live feed are presented on https://www.fabric.ch/Atomized/
-----
By fabric | ch

The "Pulsar Map" (Peirce quincuncial projection), or live environmental data coming from the selected planetary and historical setllements locations: Venice (IT), Athens (GR), Uruk (IR), Tokyo (JP), Vancouver (CA), Chicago (US), Manchester (EN), Brasilia (BR), North Pole (-). These live data help us build a fictional and planetary live space, to be investigated by Atomized/Retrofitted Functioning.
Atomized/Retrofitted Functioning
Loosely inspired by particle physics experiments, where collisions reveal fundamental forces, the project explores new spatial paradigms by rethinking past functional assemblies. It parallels retrofitting, adapting spatial configurations to evolving climates and digital realities rather than following fixed models.
Drawing at the same time on vernacular architecture, which historically responded to local climates through material intelligence (notably the work of Professors F. Aubry at EPFL, and B. Rodofsky at Cooper Union, as well as Philippe Rahm’s contemporary interpretation), the project extends this logic into computational realms. It examines the patterns and phasing effects of contemporary space between material and non-material milieux.
The project takes form as an abstract and speculative habitable volume, where environmental data from key locations in human habitation evolution generate shifting conditions—day and night, hot and cold, urban and desert—coexisting in one space. This approach enables simulations of future climatic conditions, while using real-time data from 2025 during the Venice Biennale.


Presented as a video screencast of an application running live on a server in fabric | ch's studio, driven by machine learning, the project autonomously generates spatial scenarios that stabilize twice a day. These can be downloaded in parallel as an immersive, walkable AR/VR experience.
...
Then, tendencies can be drawn: what is the average presence of a certain type of content (functional, non-functional) over 3 or 6 months (from May to November 2025), for instance, or also only during Venetian nights? During Spring or Summer, etc.? Incoming climate behaviour could also be extrapolated from scientific forecasts: what will the climate be like in 2050? And in 2100? Or conversely, what was it like in 1972, for instance (the year The Limits to Growth was published, which was a clear first warning—even if imperfect—of what was to come if “growth” remained unchecked)?
...
And then, from a haze of potential space use, and non-use, opened and closed volumes can be drawn. None of them being entirely suitable, frozen shapes framing freely evolving conditions.


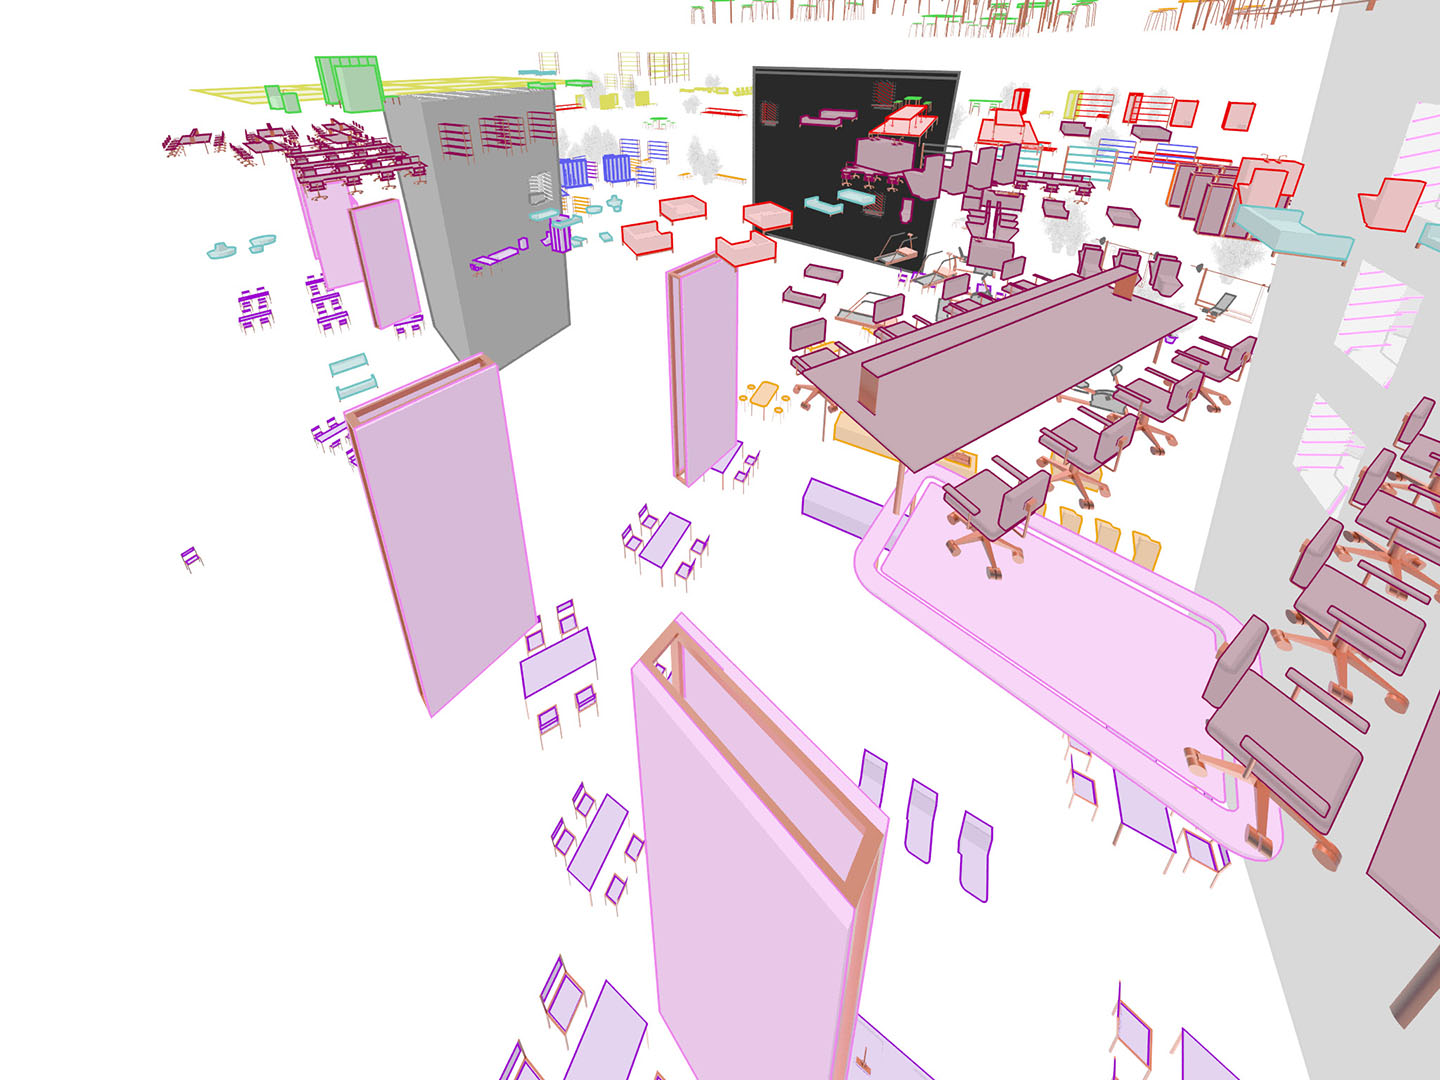
Images from the project Responsive Atmospheric Patios – extended experiments (fabric | ch, 2016).
...
Atomized/Retrofitted Functioning is presented in a standardized way by the curatorial team, with the screencast video of the application running on the servers of fabric | ch. It is installed in the Artificiale section of the Biennale, next to the iconic–and somehow problematic–Seek project (1969–1070), by Nicolas Negroponte and Leon Groisser at the MIT Architecture Machine Group. Next to Architecture as a Living System, by John and Julia Frazer—as part of Cedric Price's Generator project (1976–79), but also of more contemporary (post-)critical takes on "computing" and "cybernetics" through the work of Kate Crawford and Vladan Joler (Calculating Empires, 2022), and others.


Atomized/Retrofitted Functioning in the Corderie building, at Biennale Architettura 2025.19th International Architecture Exhibition, Venice 10.05 – 23.11.2025.
...
The project can also be "followed" during the Biennale, at this address: https://www.fabric.ch/Atomized/ , in live streaming during Biennale opening hours.
The whole genealogy of the research and its previous iterations are also accessible at the same location.


