As we continue to lack a decent search engine on this blog and as we don't use a "tag cloud" ... This post could help navigate through the updated content on | rblg (as of 09.2023), via all its tags!
FIND BELOW ALL THE TAGS THAT CAN BE USED TO NAVIGATE IN THE CONTENTS OF | RBLG BLOG:
(to be seen just below if you're navigating on the blog's html pages or here for rss readers)
--
Note that we had to hit the "pause" button on our reblogging activities a while ago (mainly because we ran out of time, but also because we received complaints from a major image stock company about some images that were displayed on | rblg, an activity that we felt was still "fair use" - we've never made any money or advertised on this site).
Nevertheless, we continue to publish from time to time information on the activities of fabric | ch, or content directly related to its work (documentation).
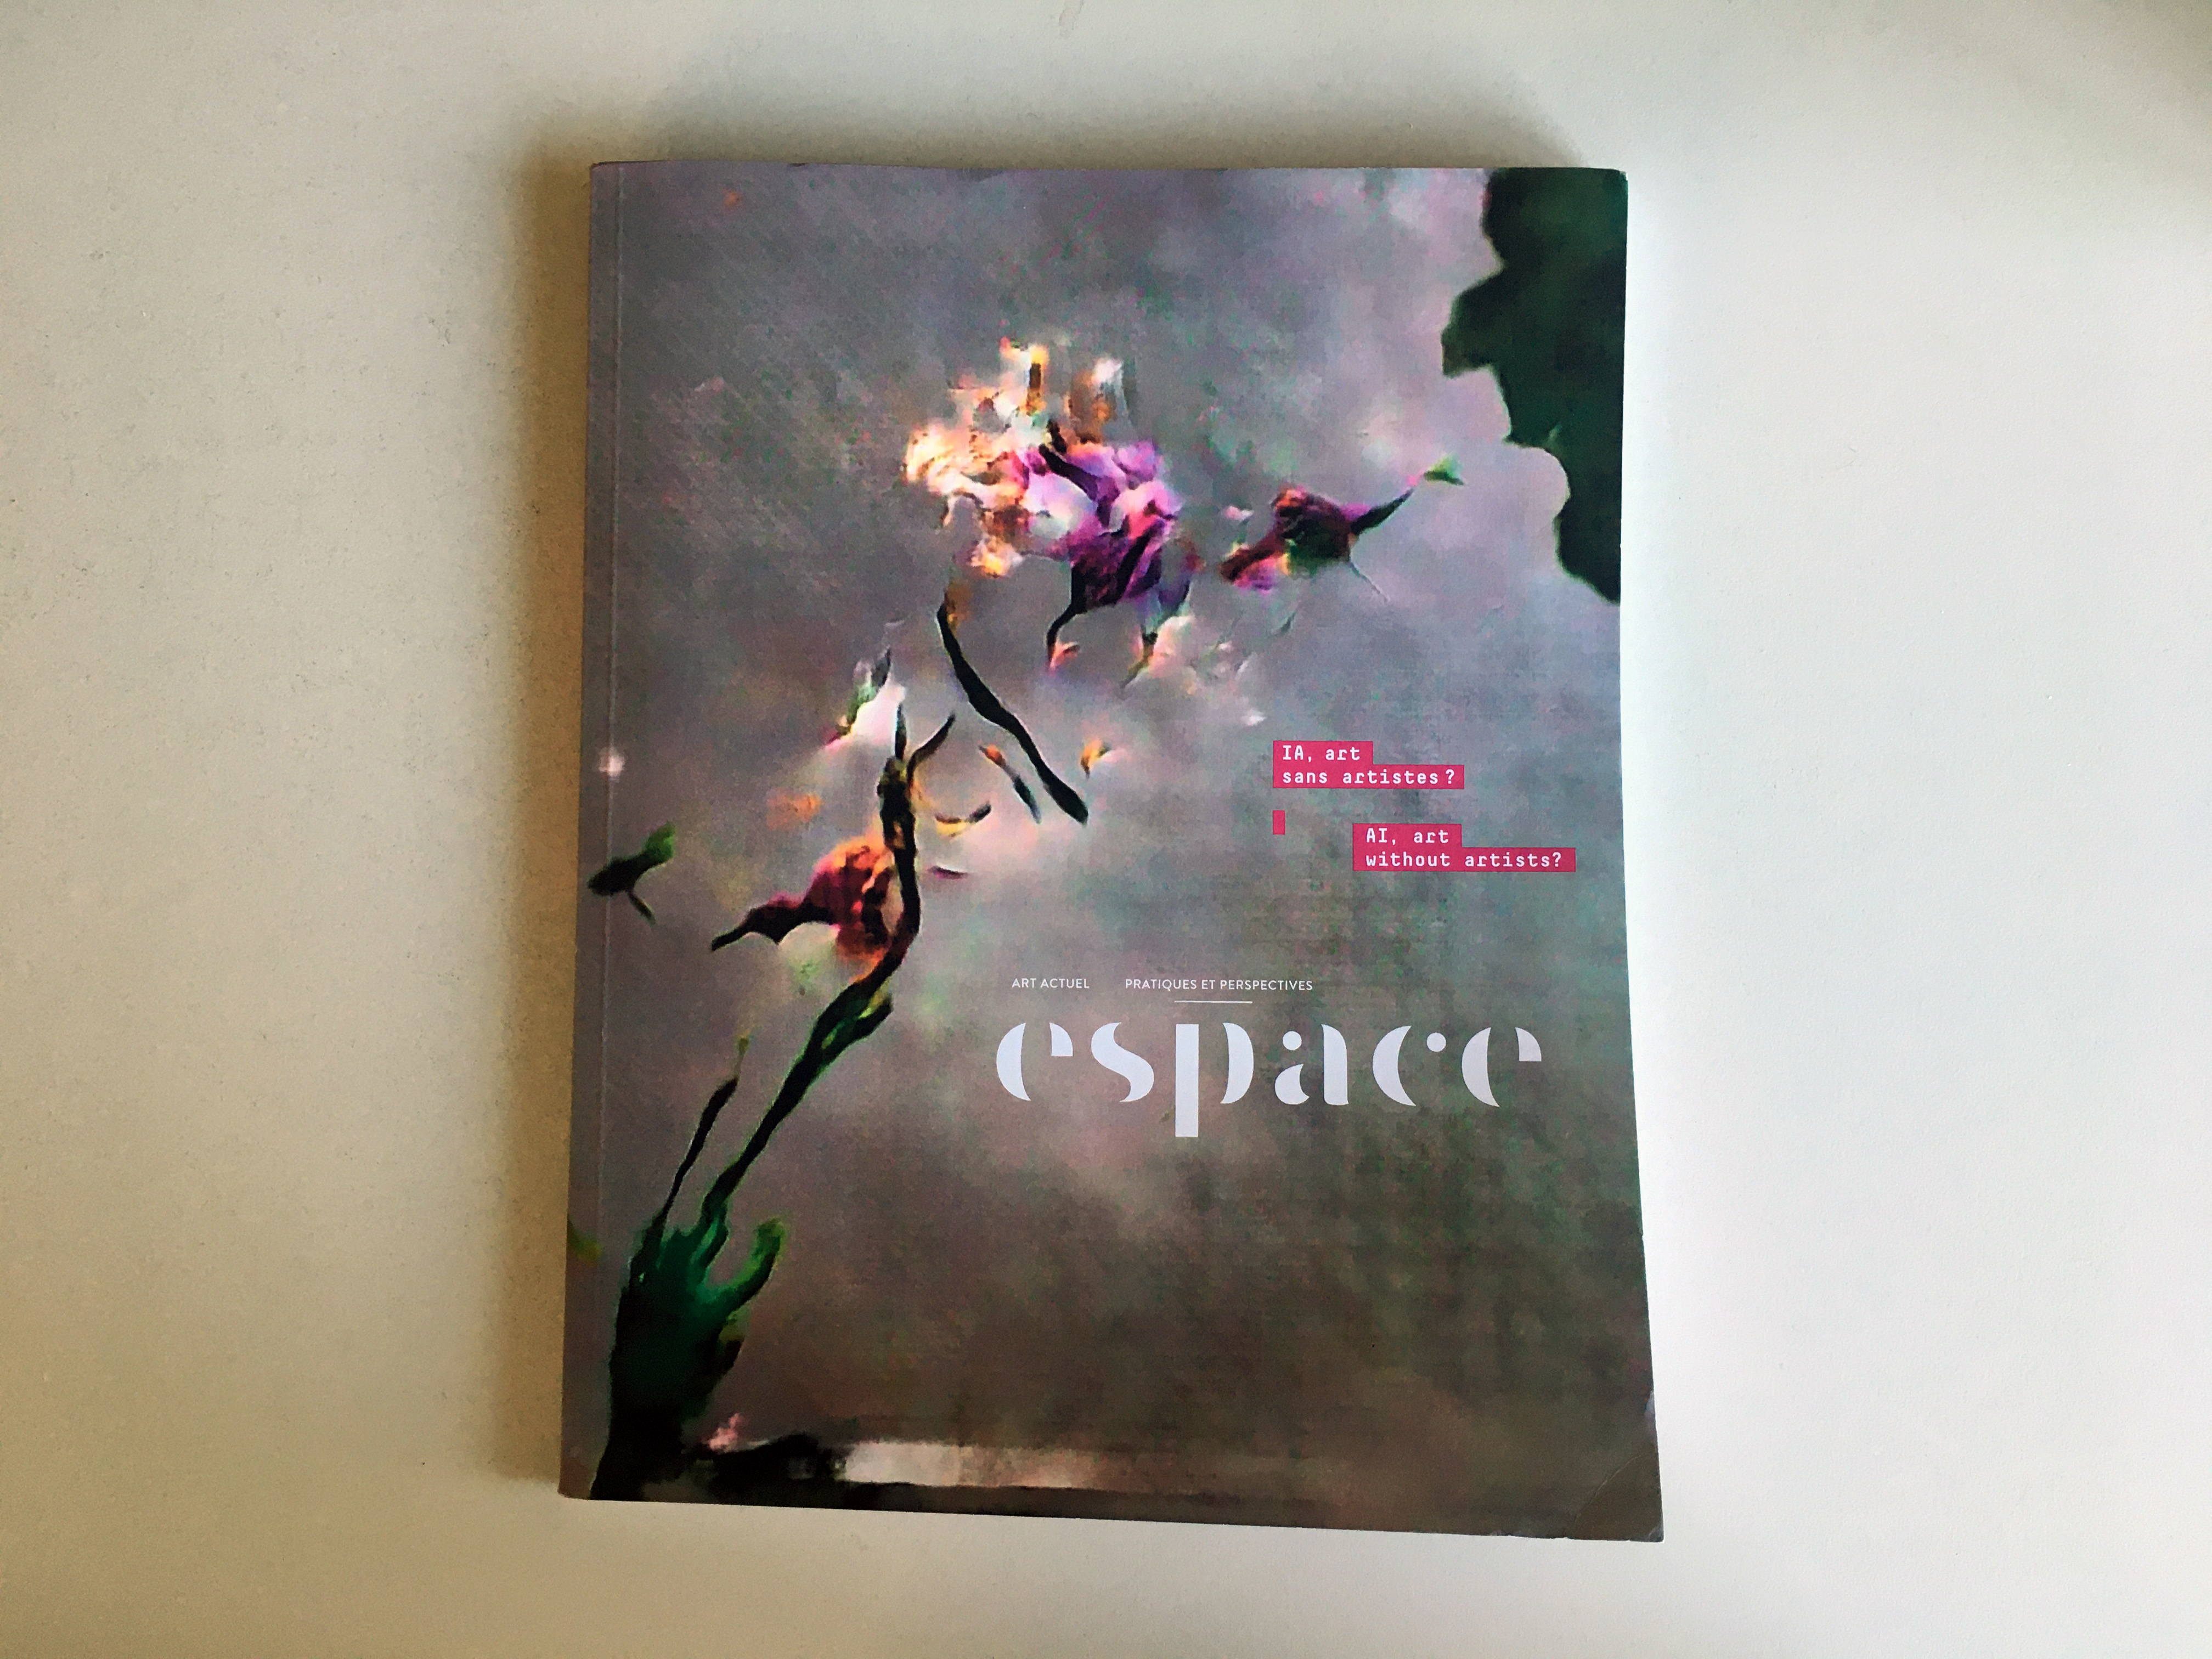
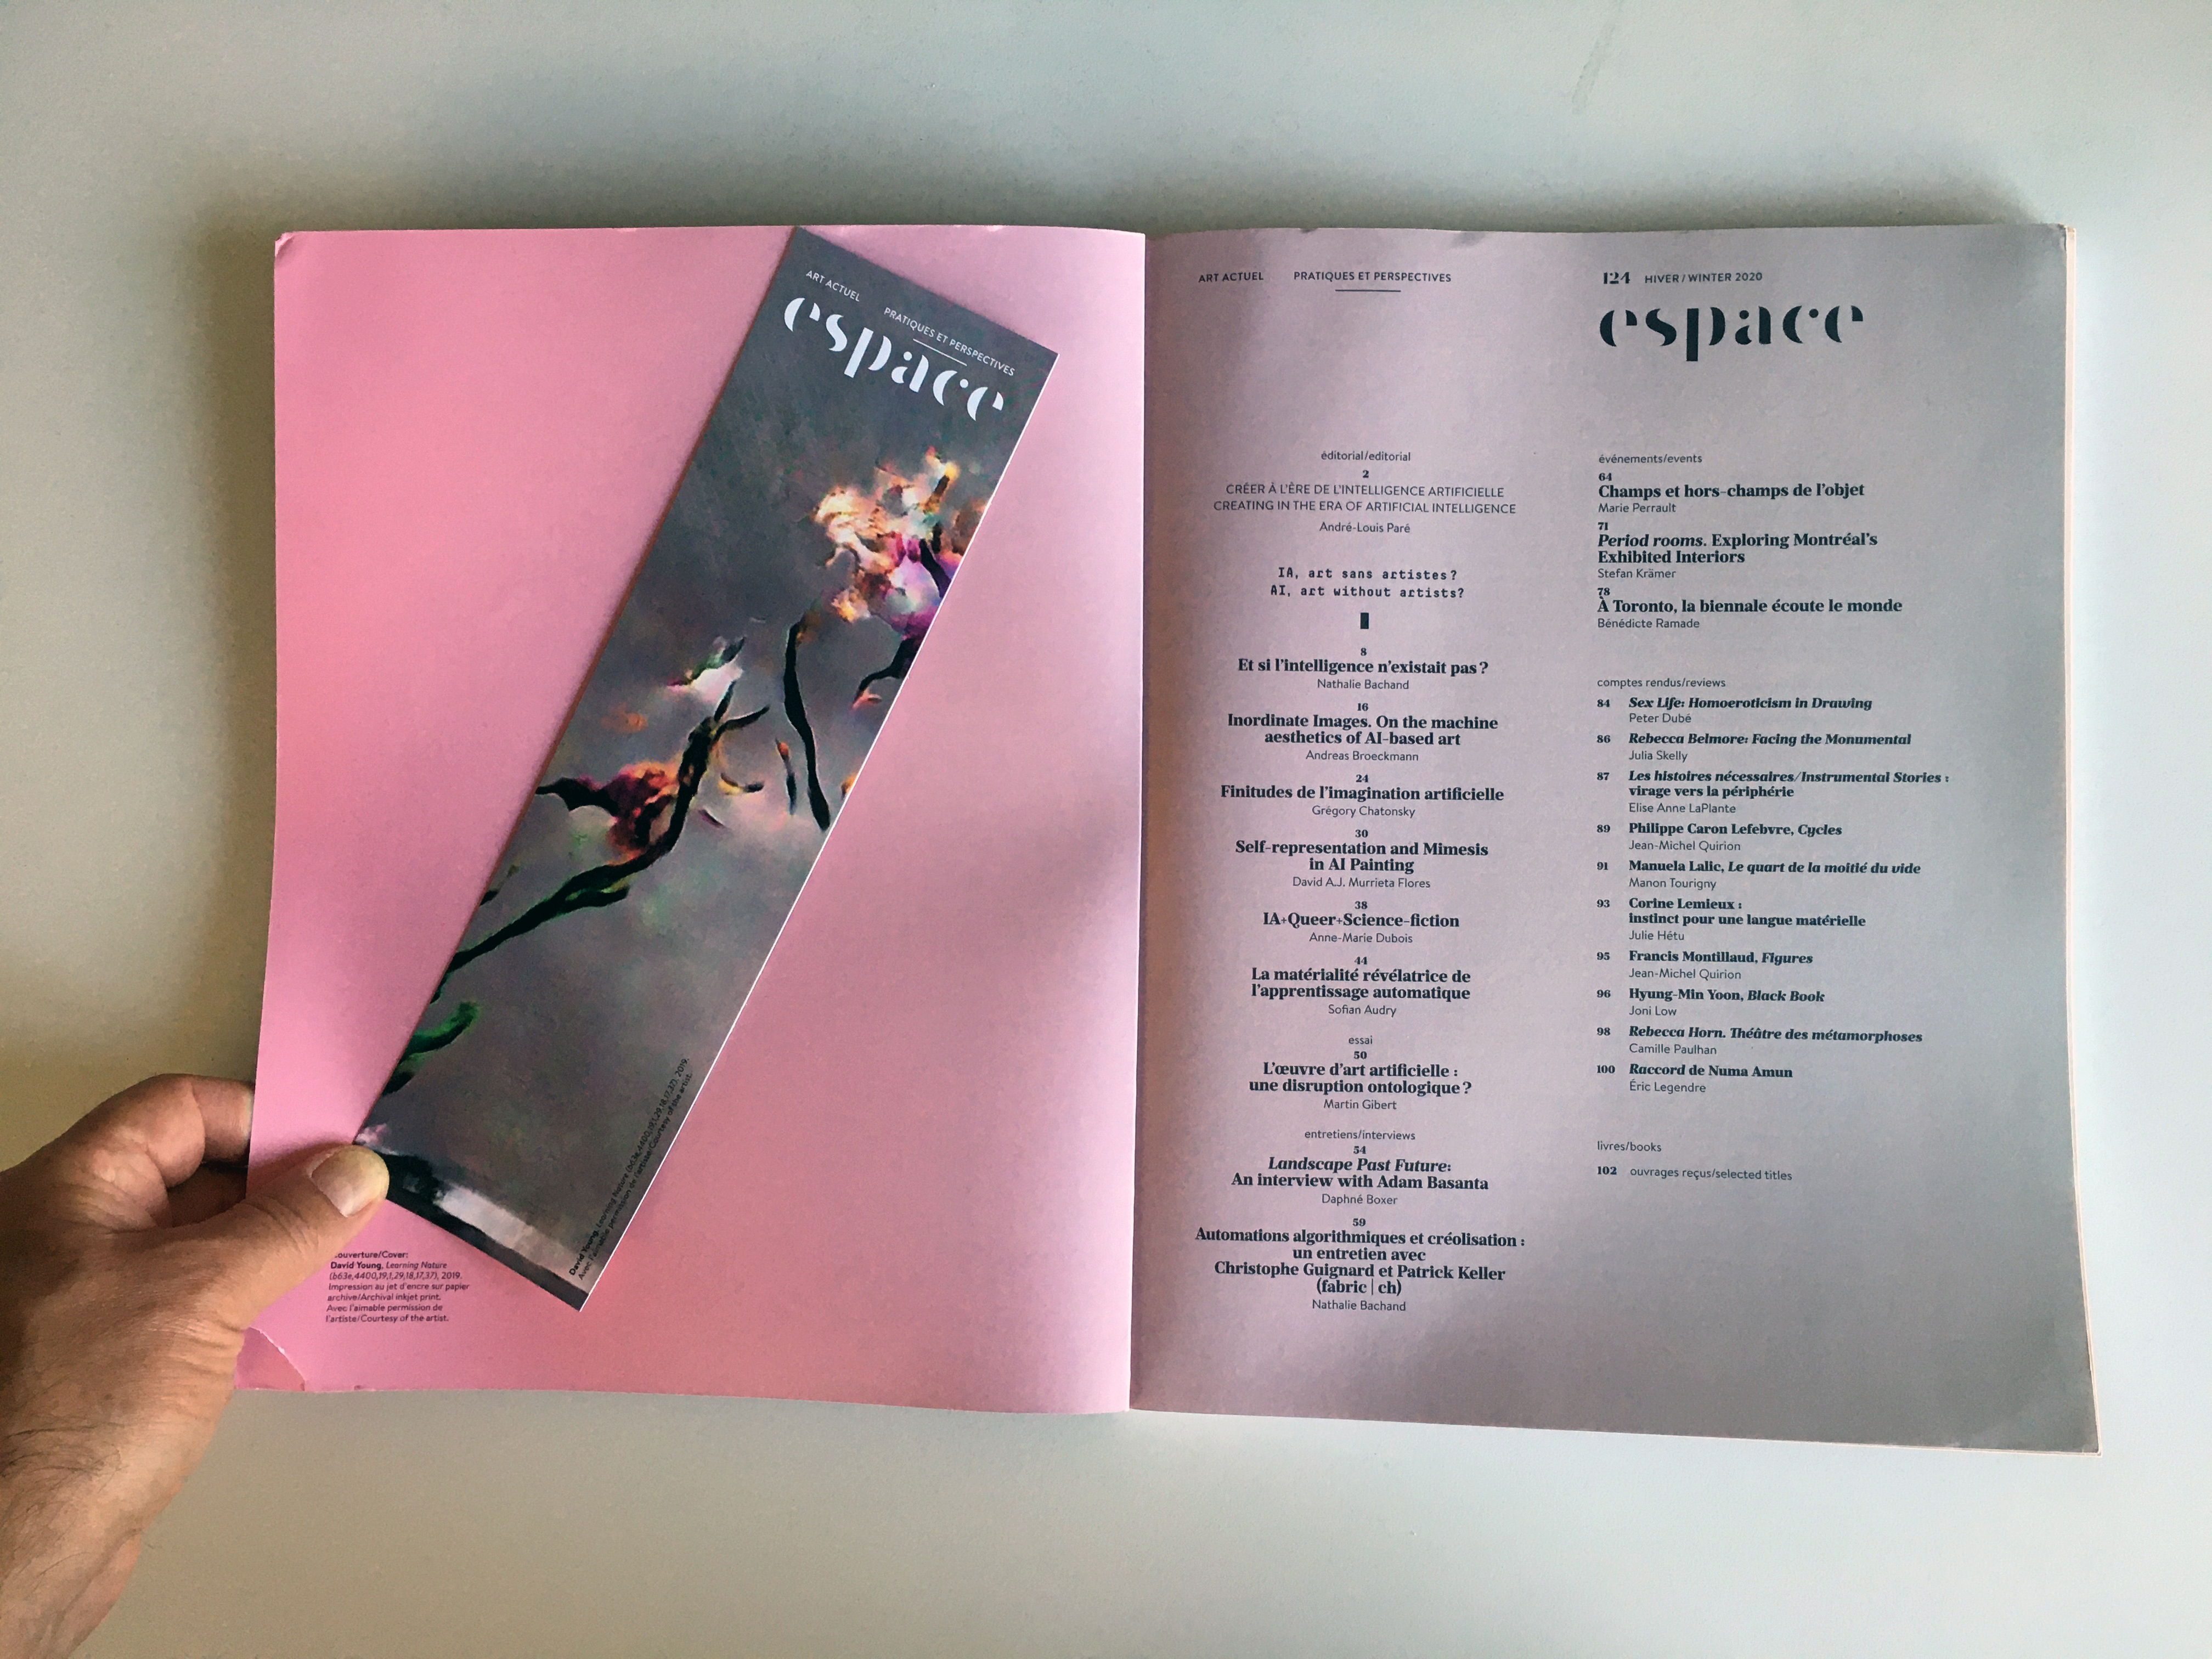
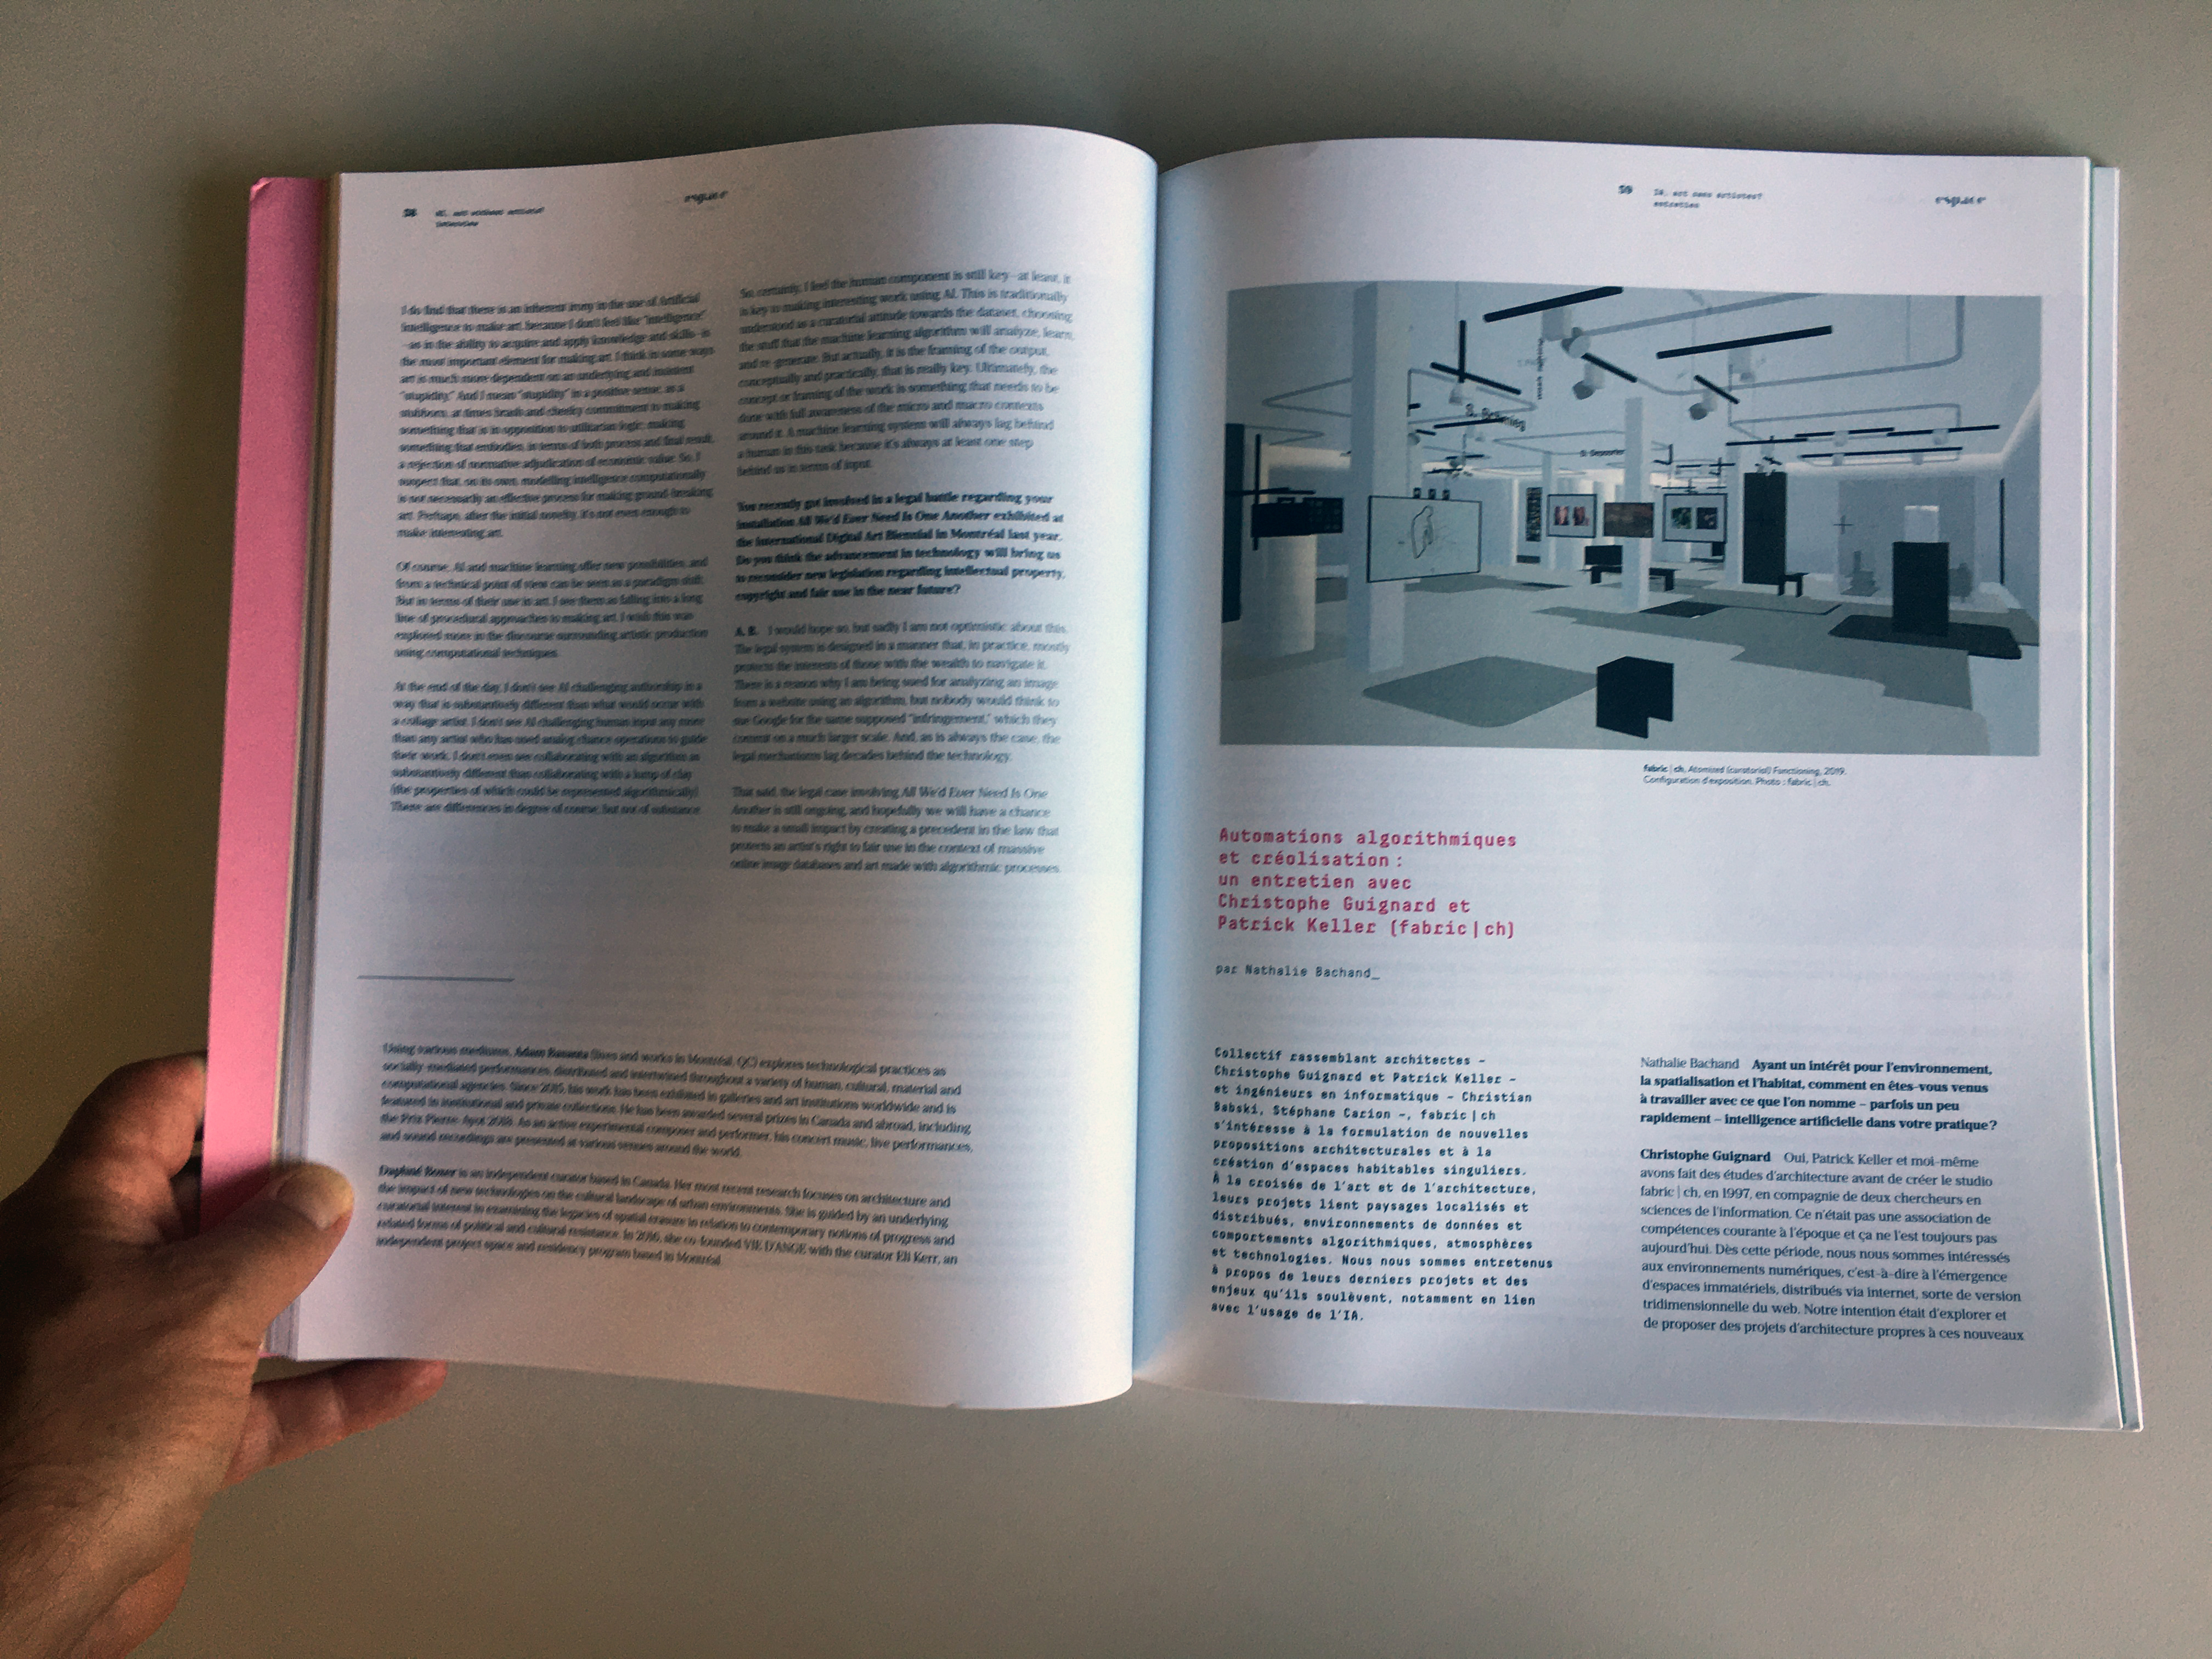
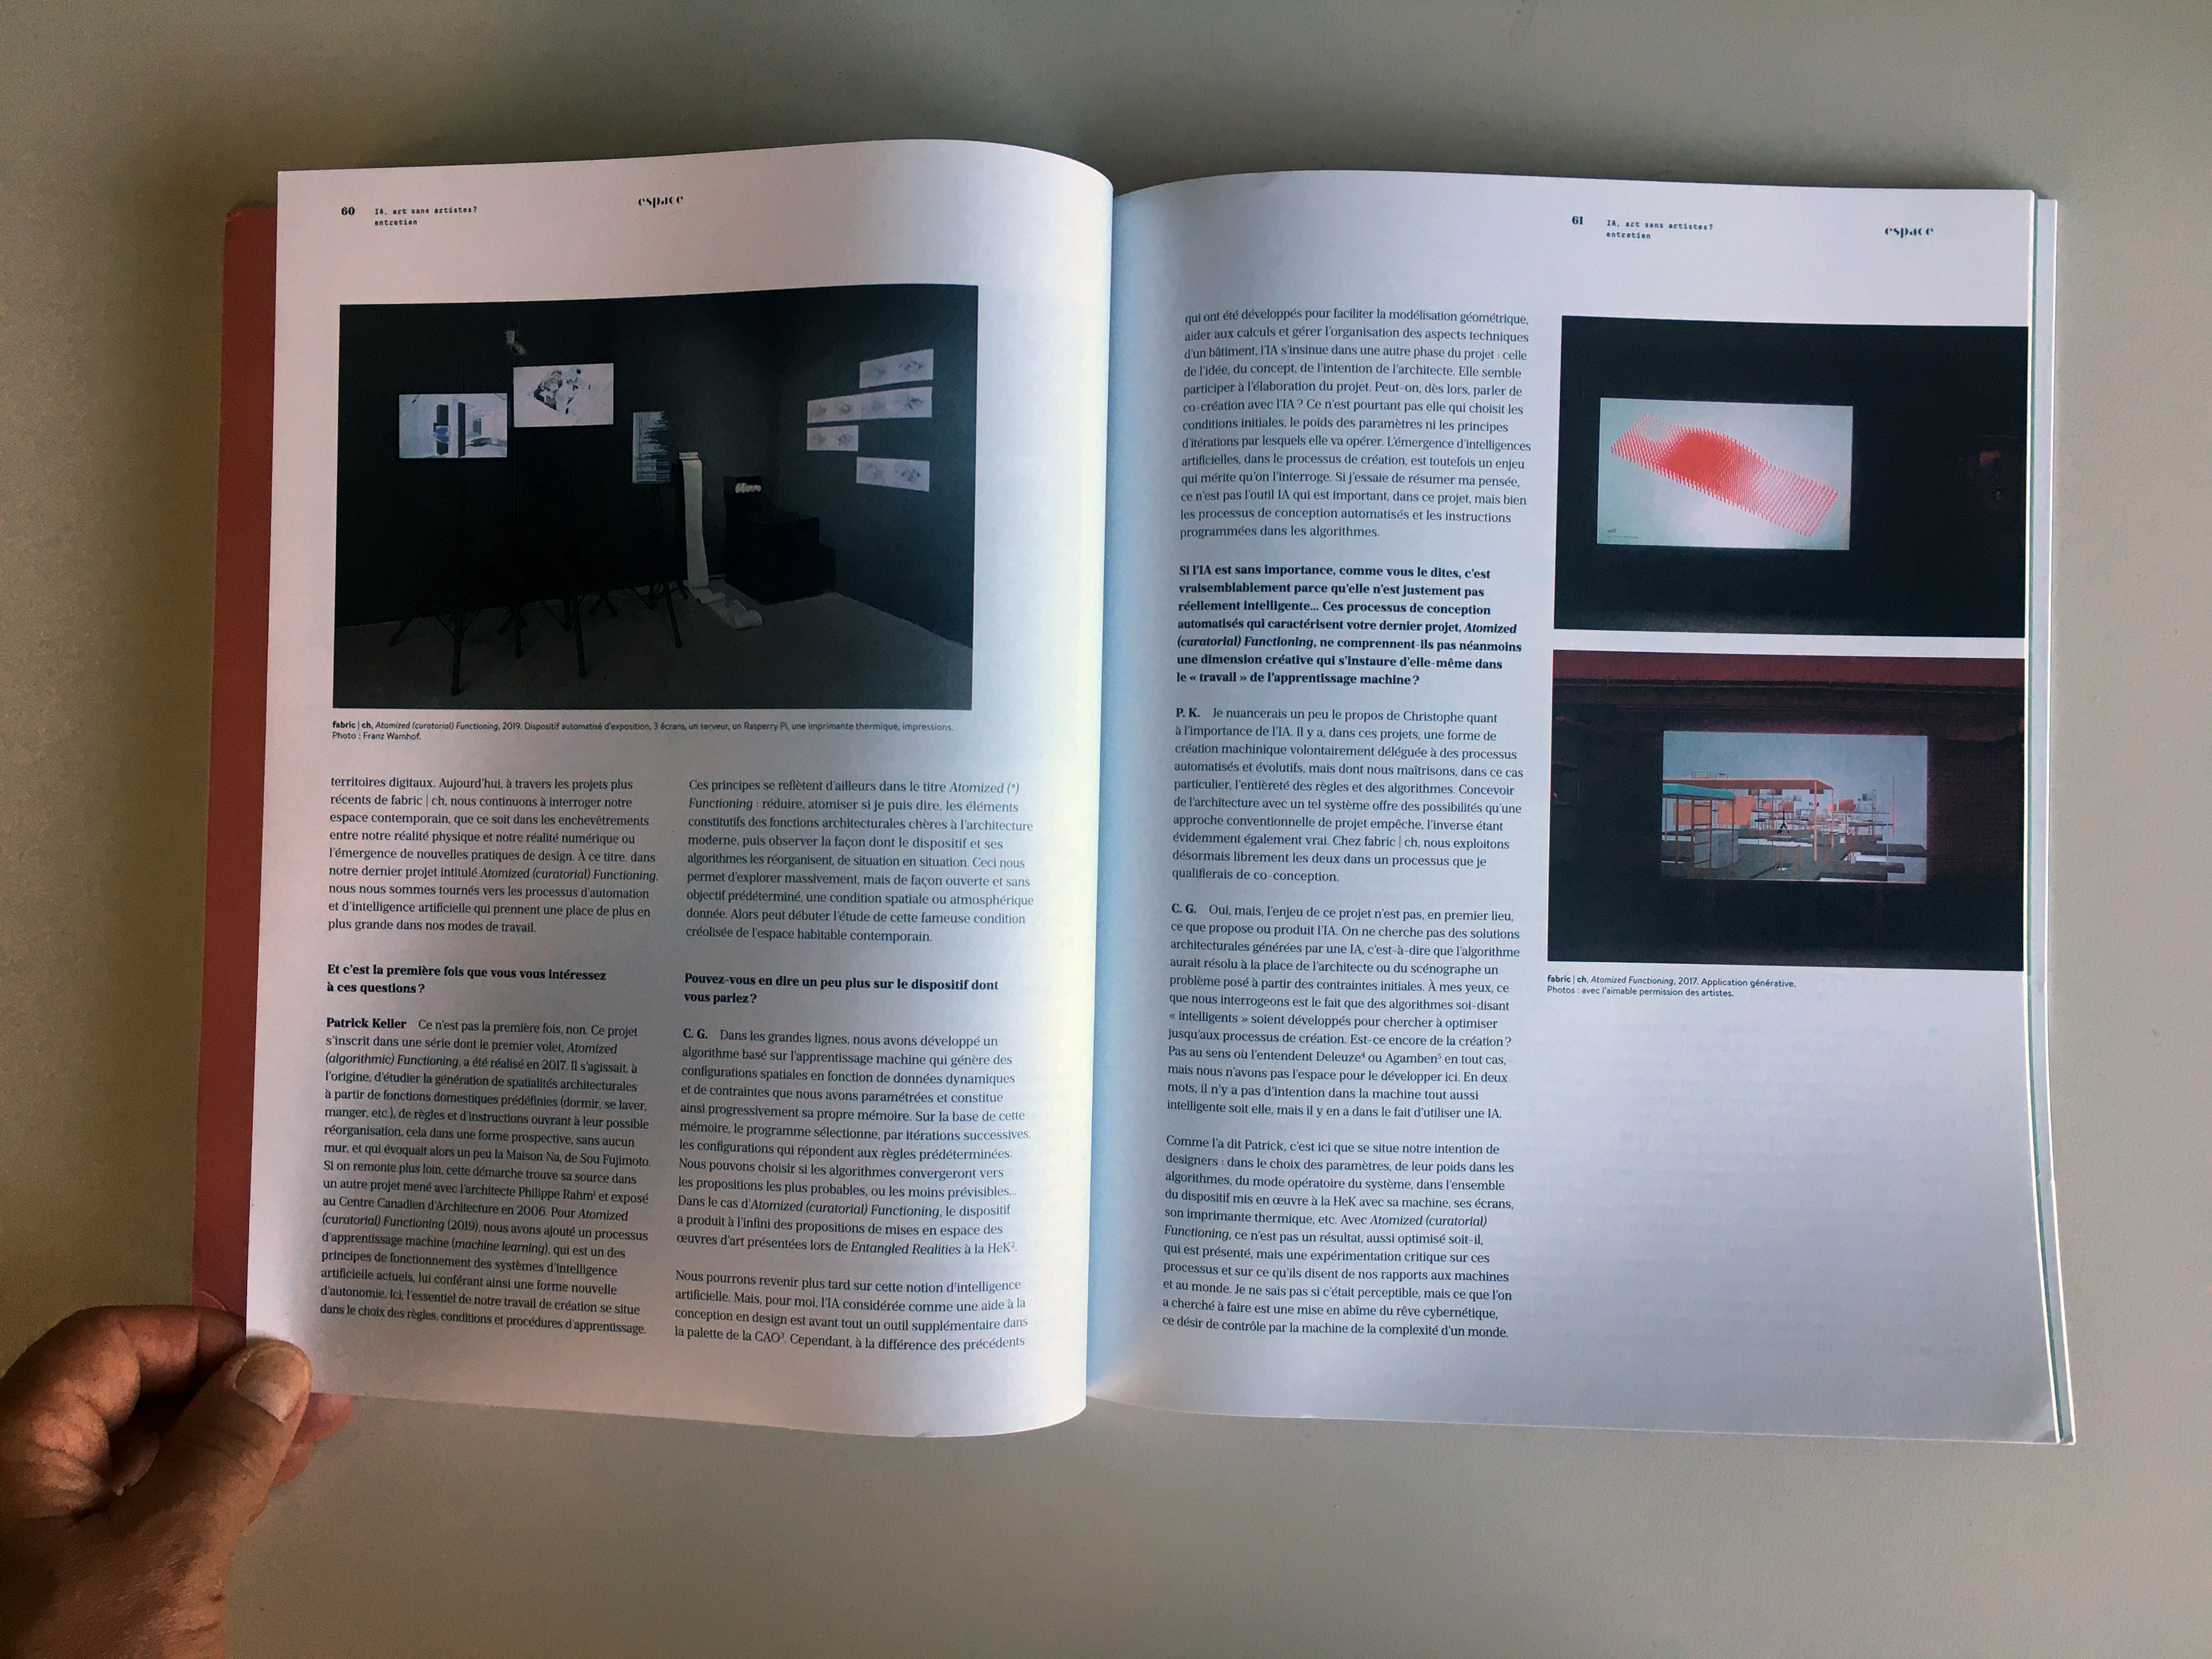
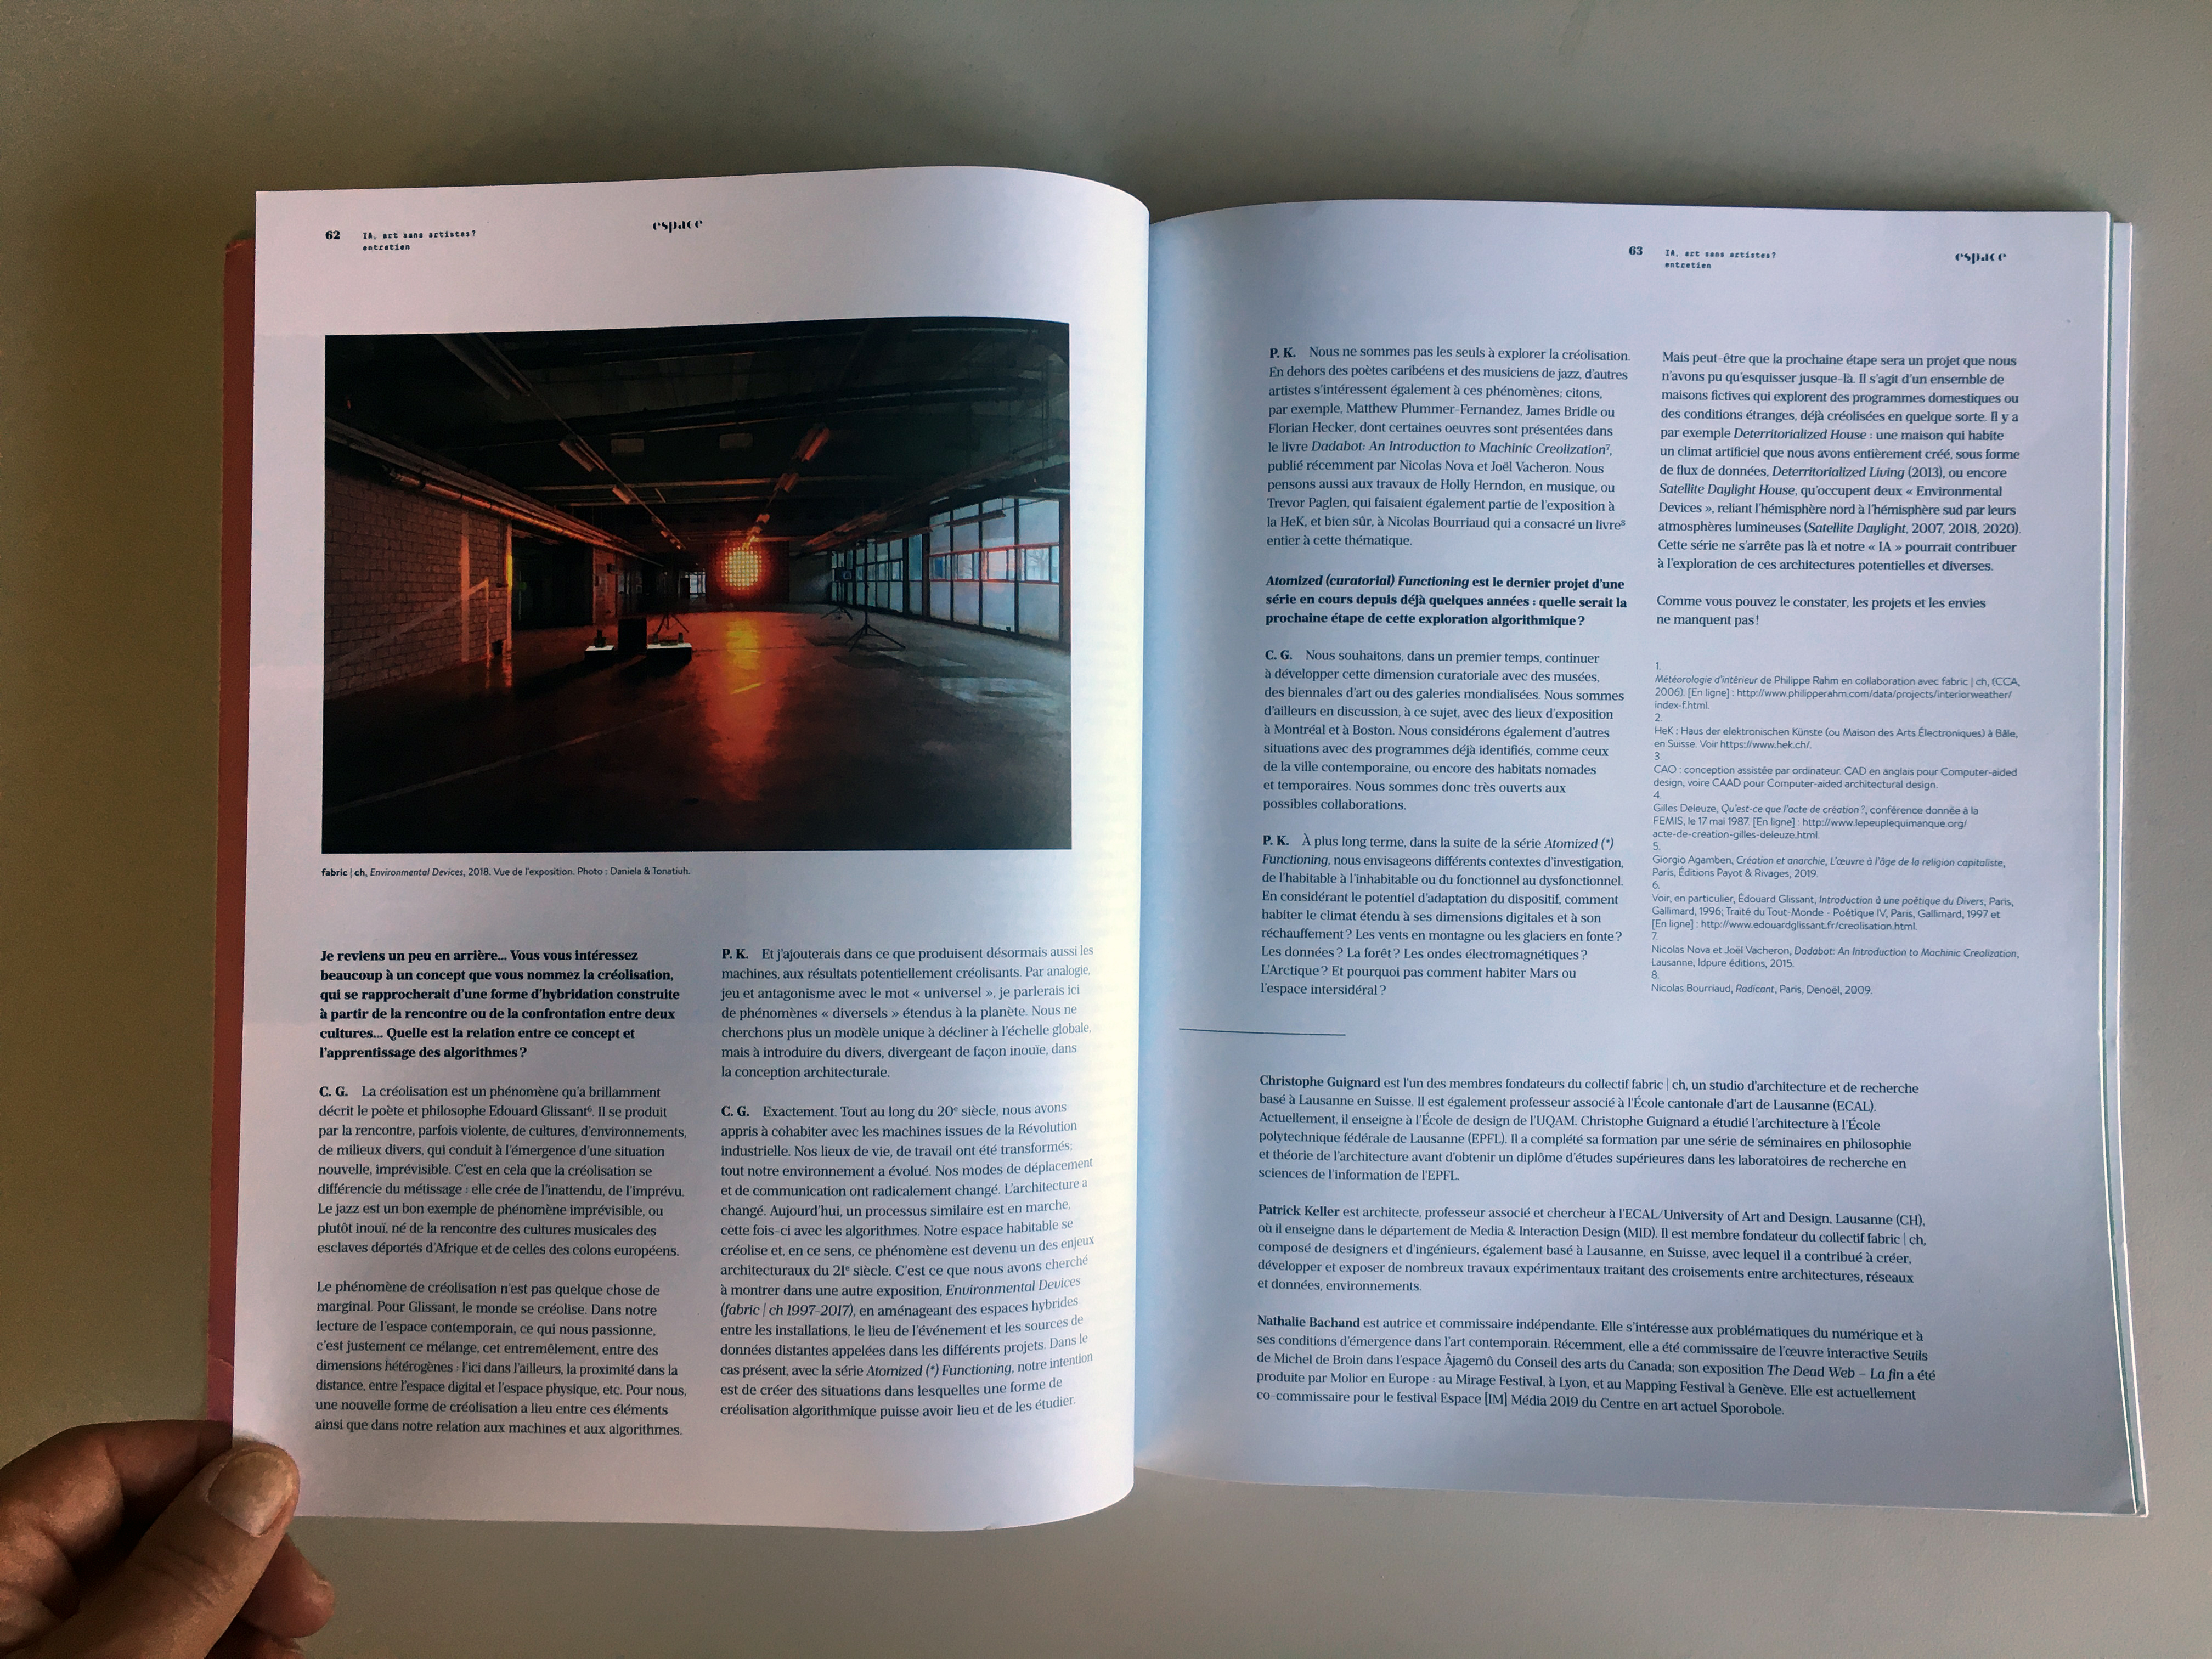
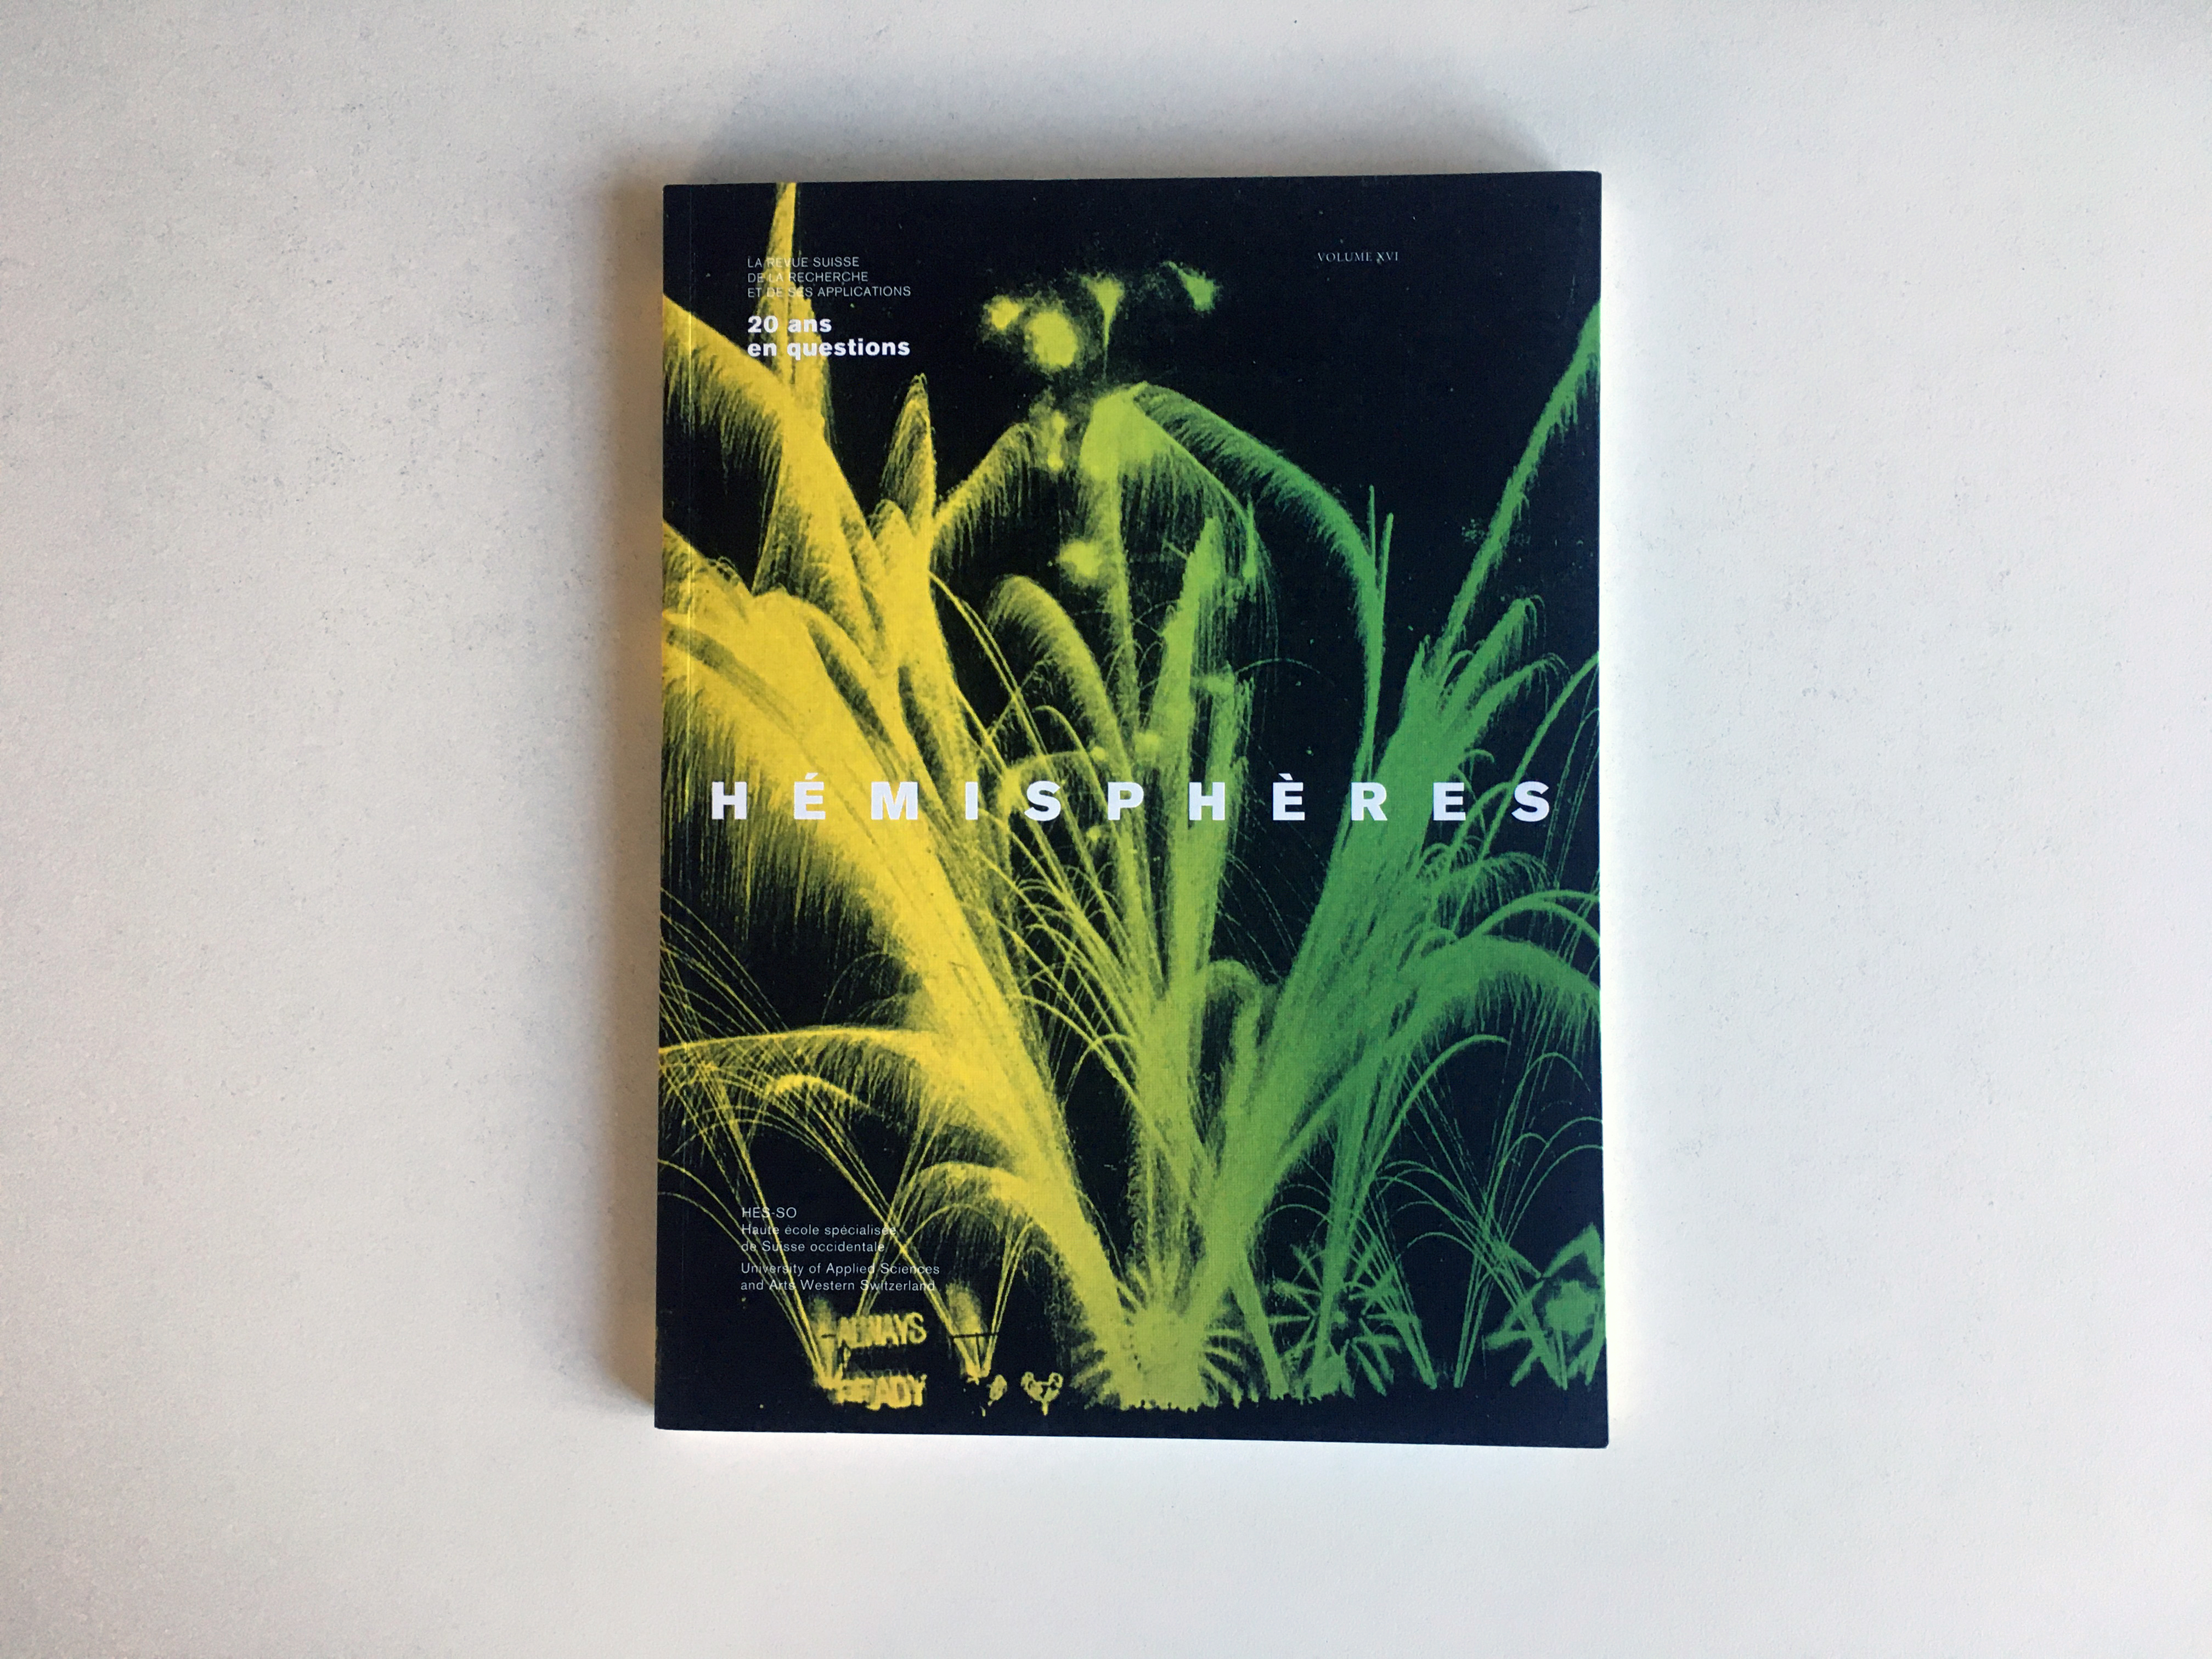
Note: an interview about the implications of AI in art and the work of fabric | ch in particular, between Nathalie Bachand (writer & independant curator), Christophe Guignard and myself (both fabric | ch). The exchange happened in the context of a publication in the art magazine Espace, it was fruitful and we had the opportunity to develop on recent projects, like the "Atomized" serie of architectural works that will continue to evolve, as well as our monographic exhibition at Kunshalle Éphémère, entitled Environmental Devices (1997 - 2017).
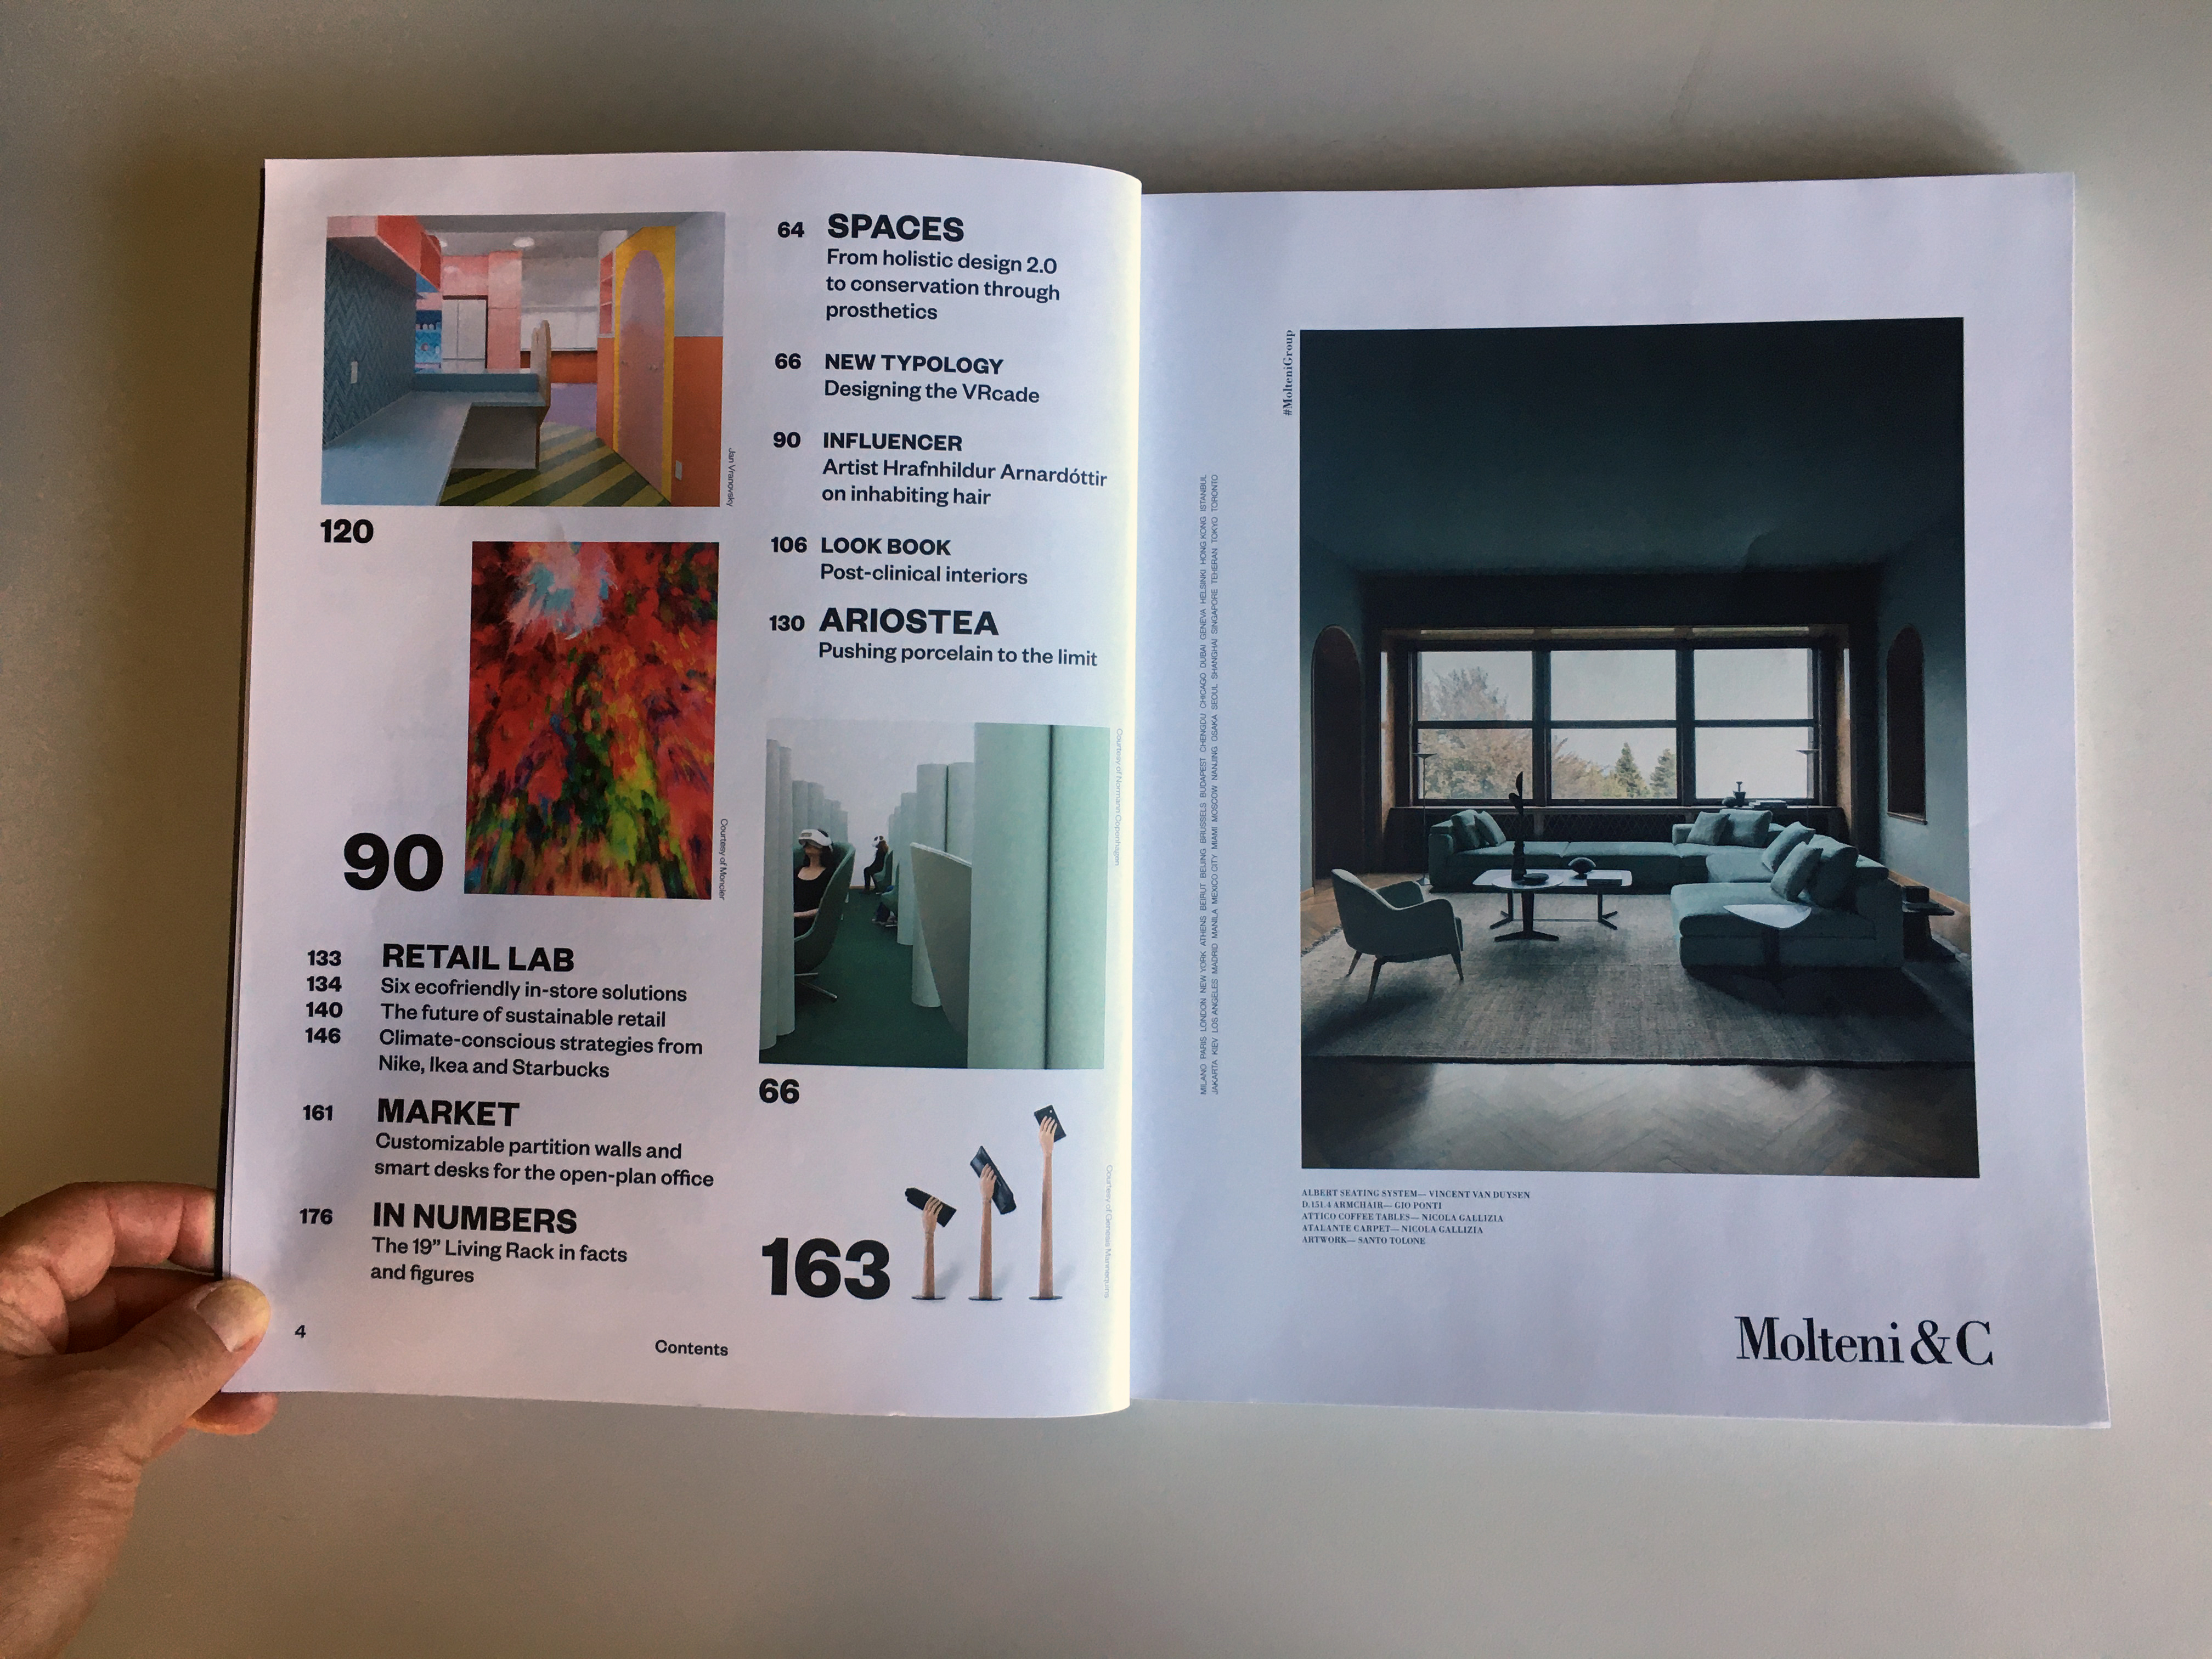
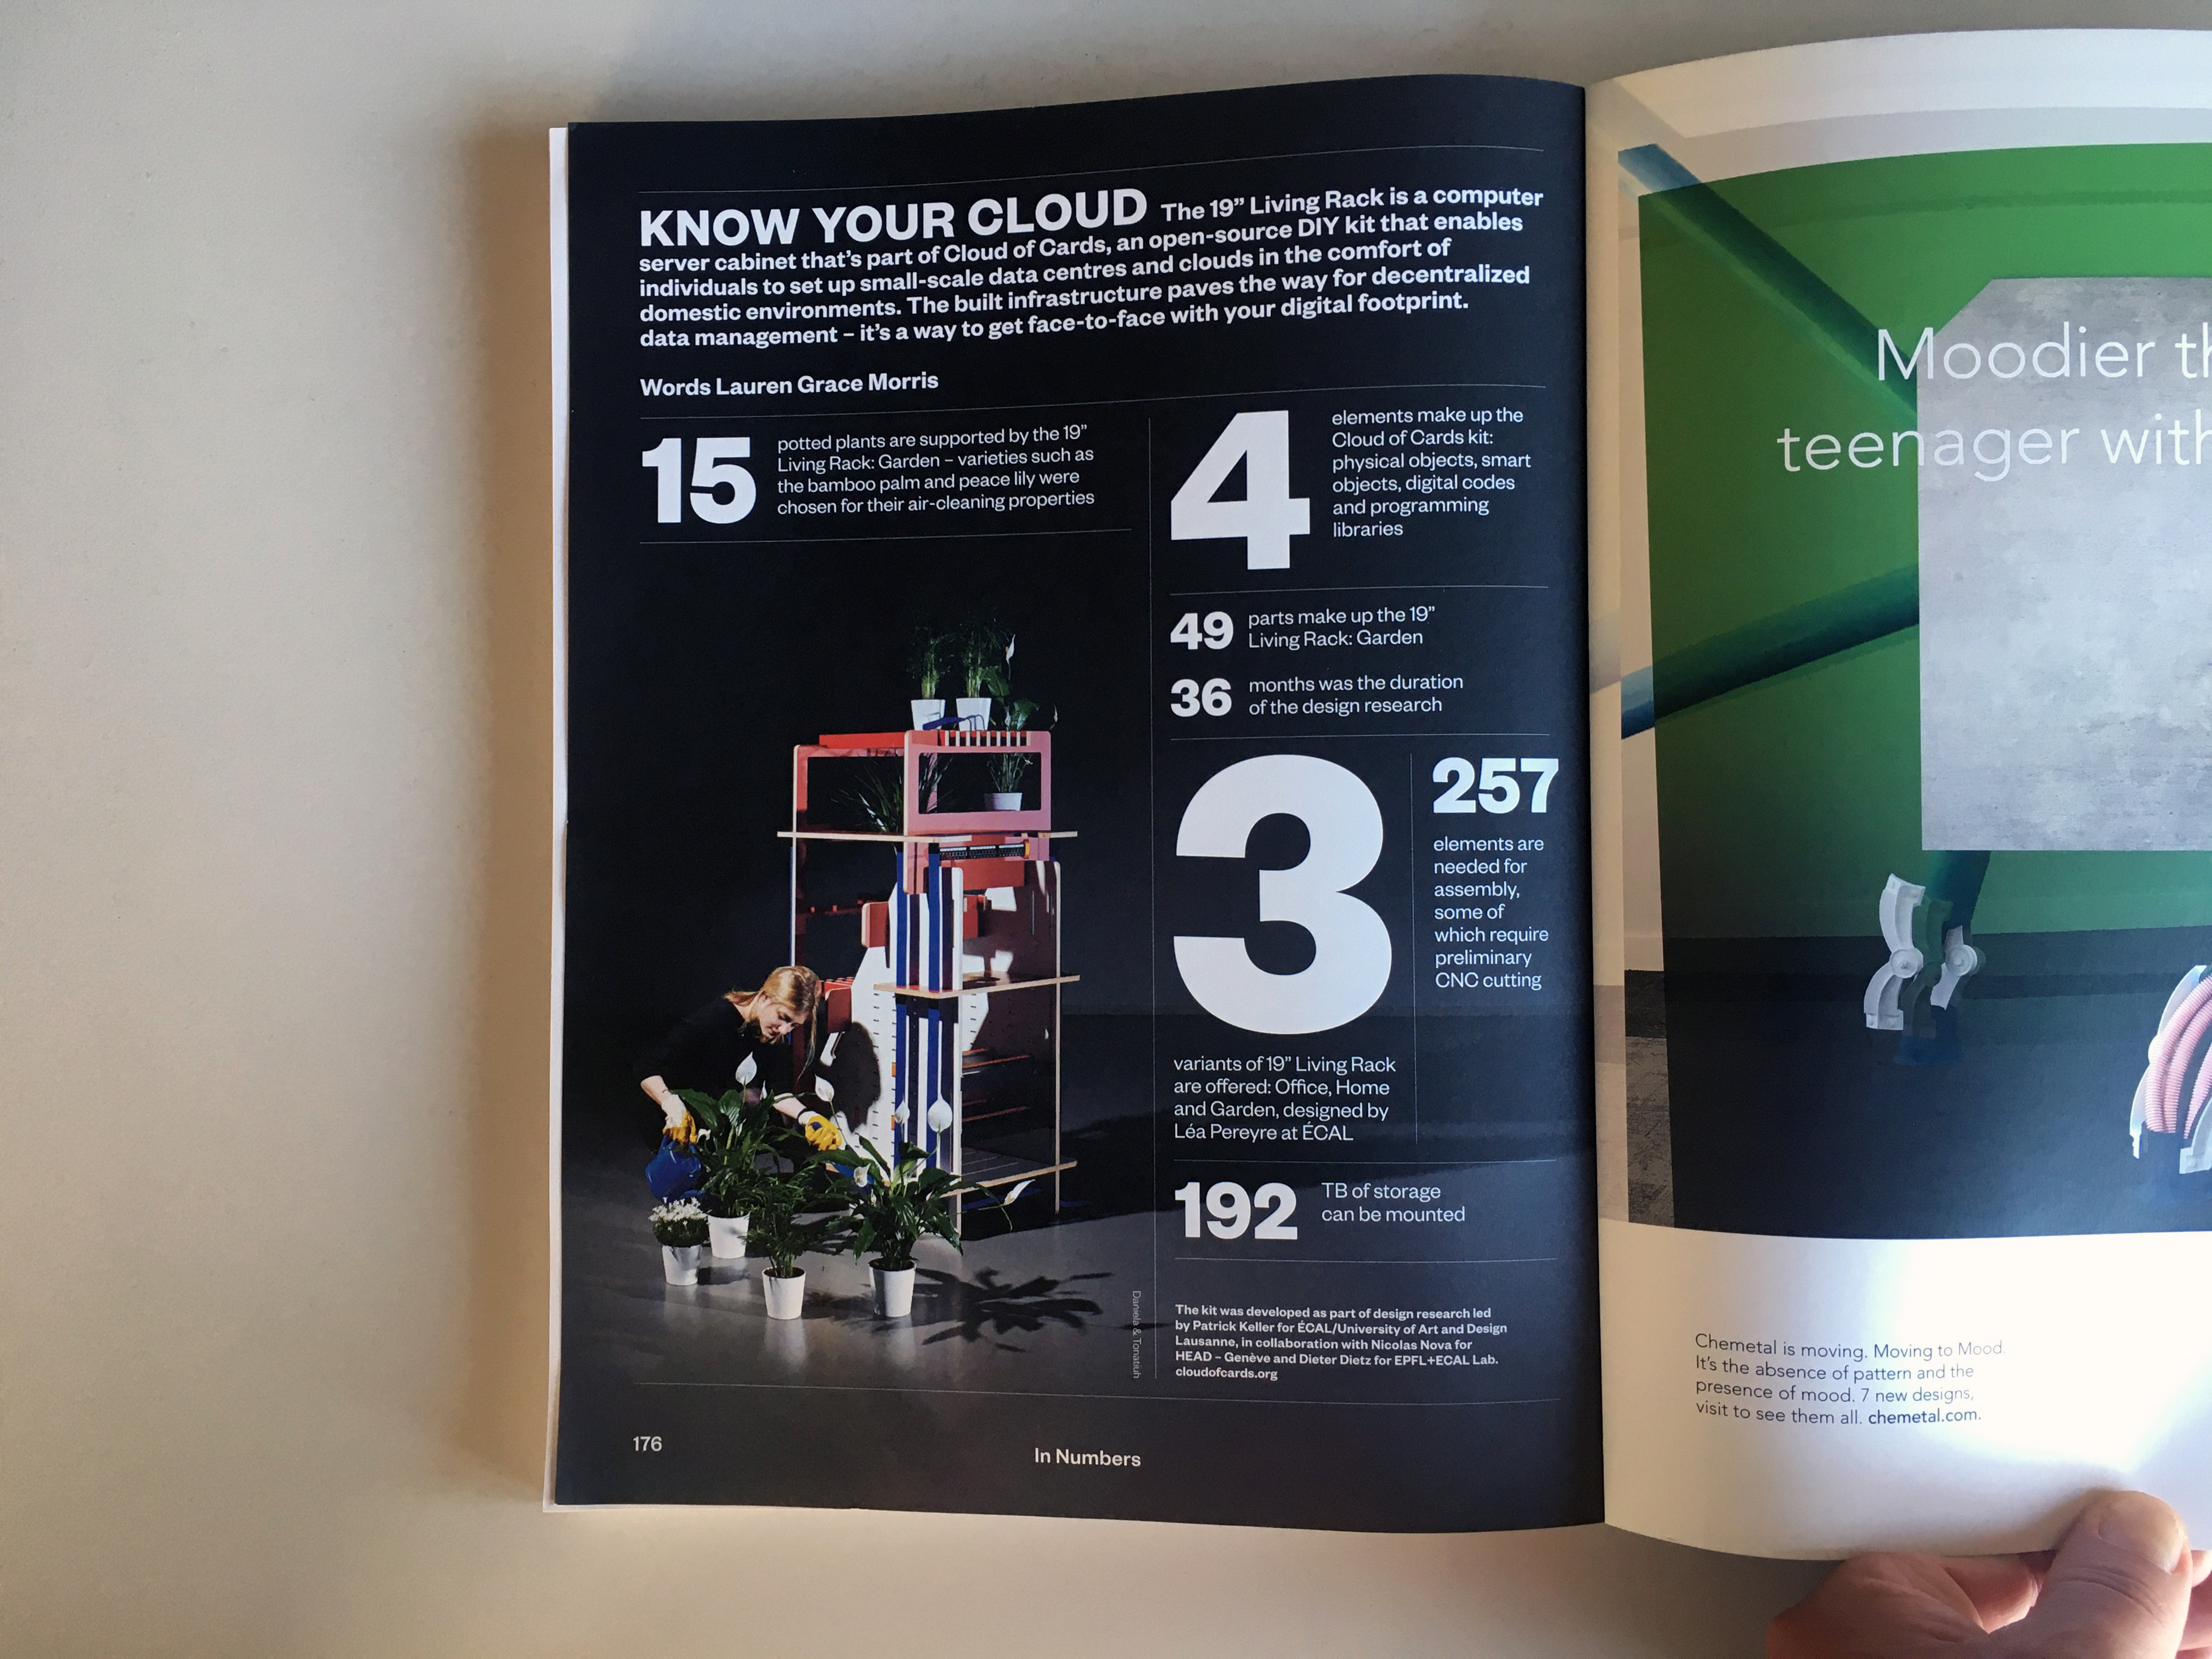
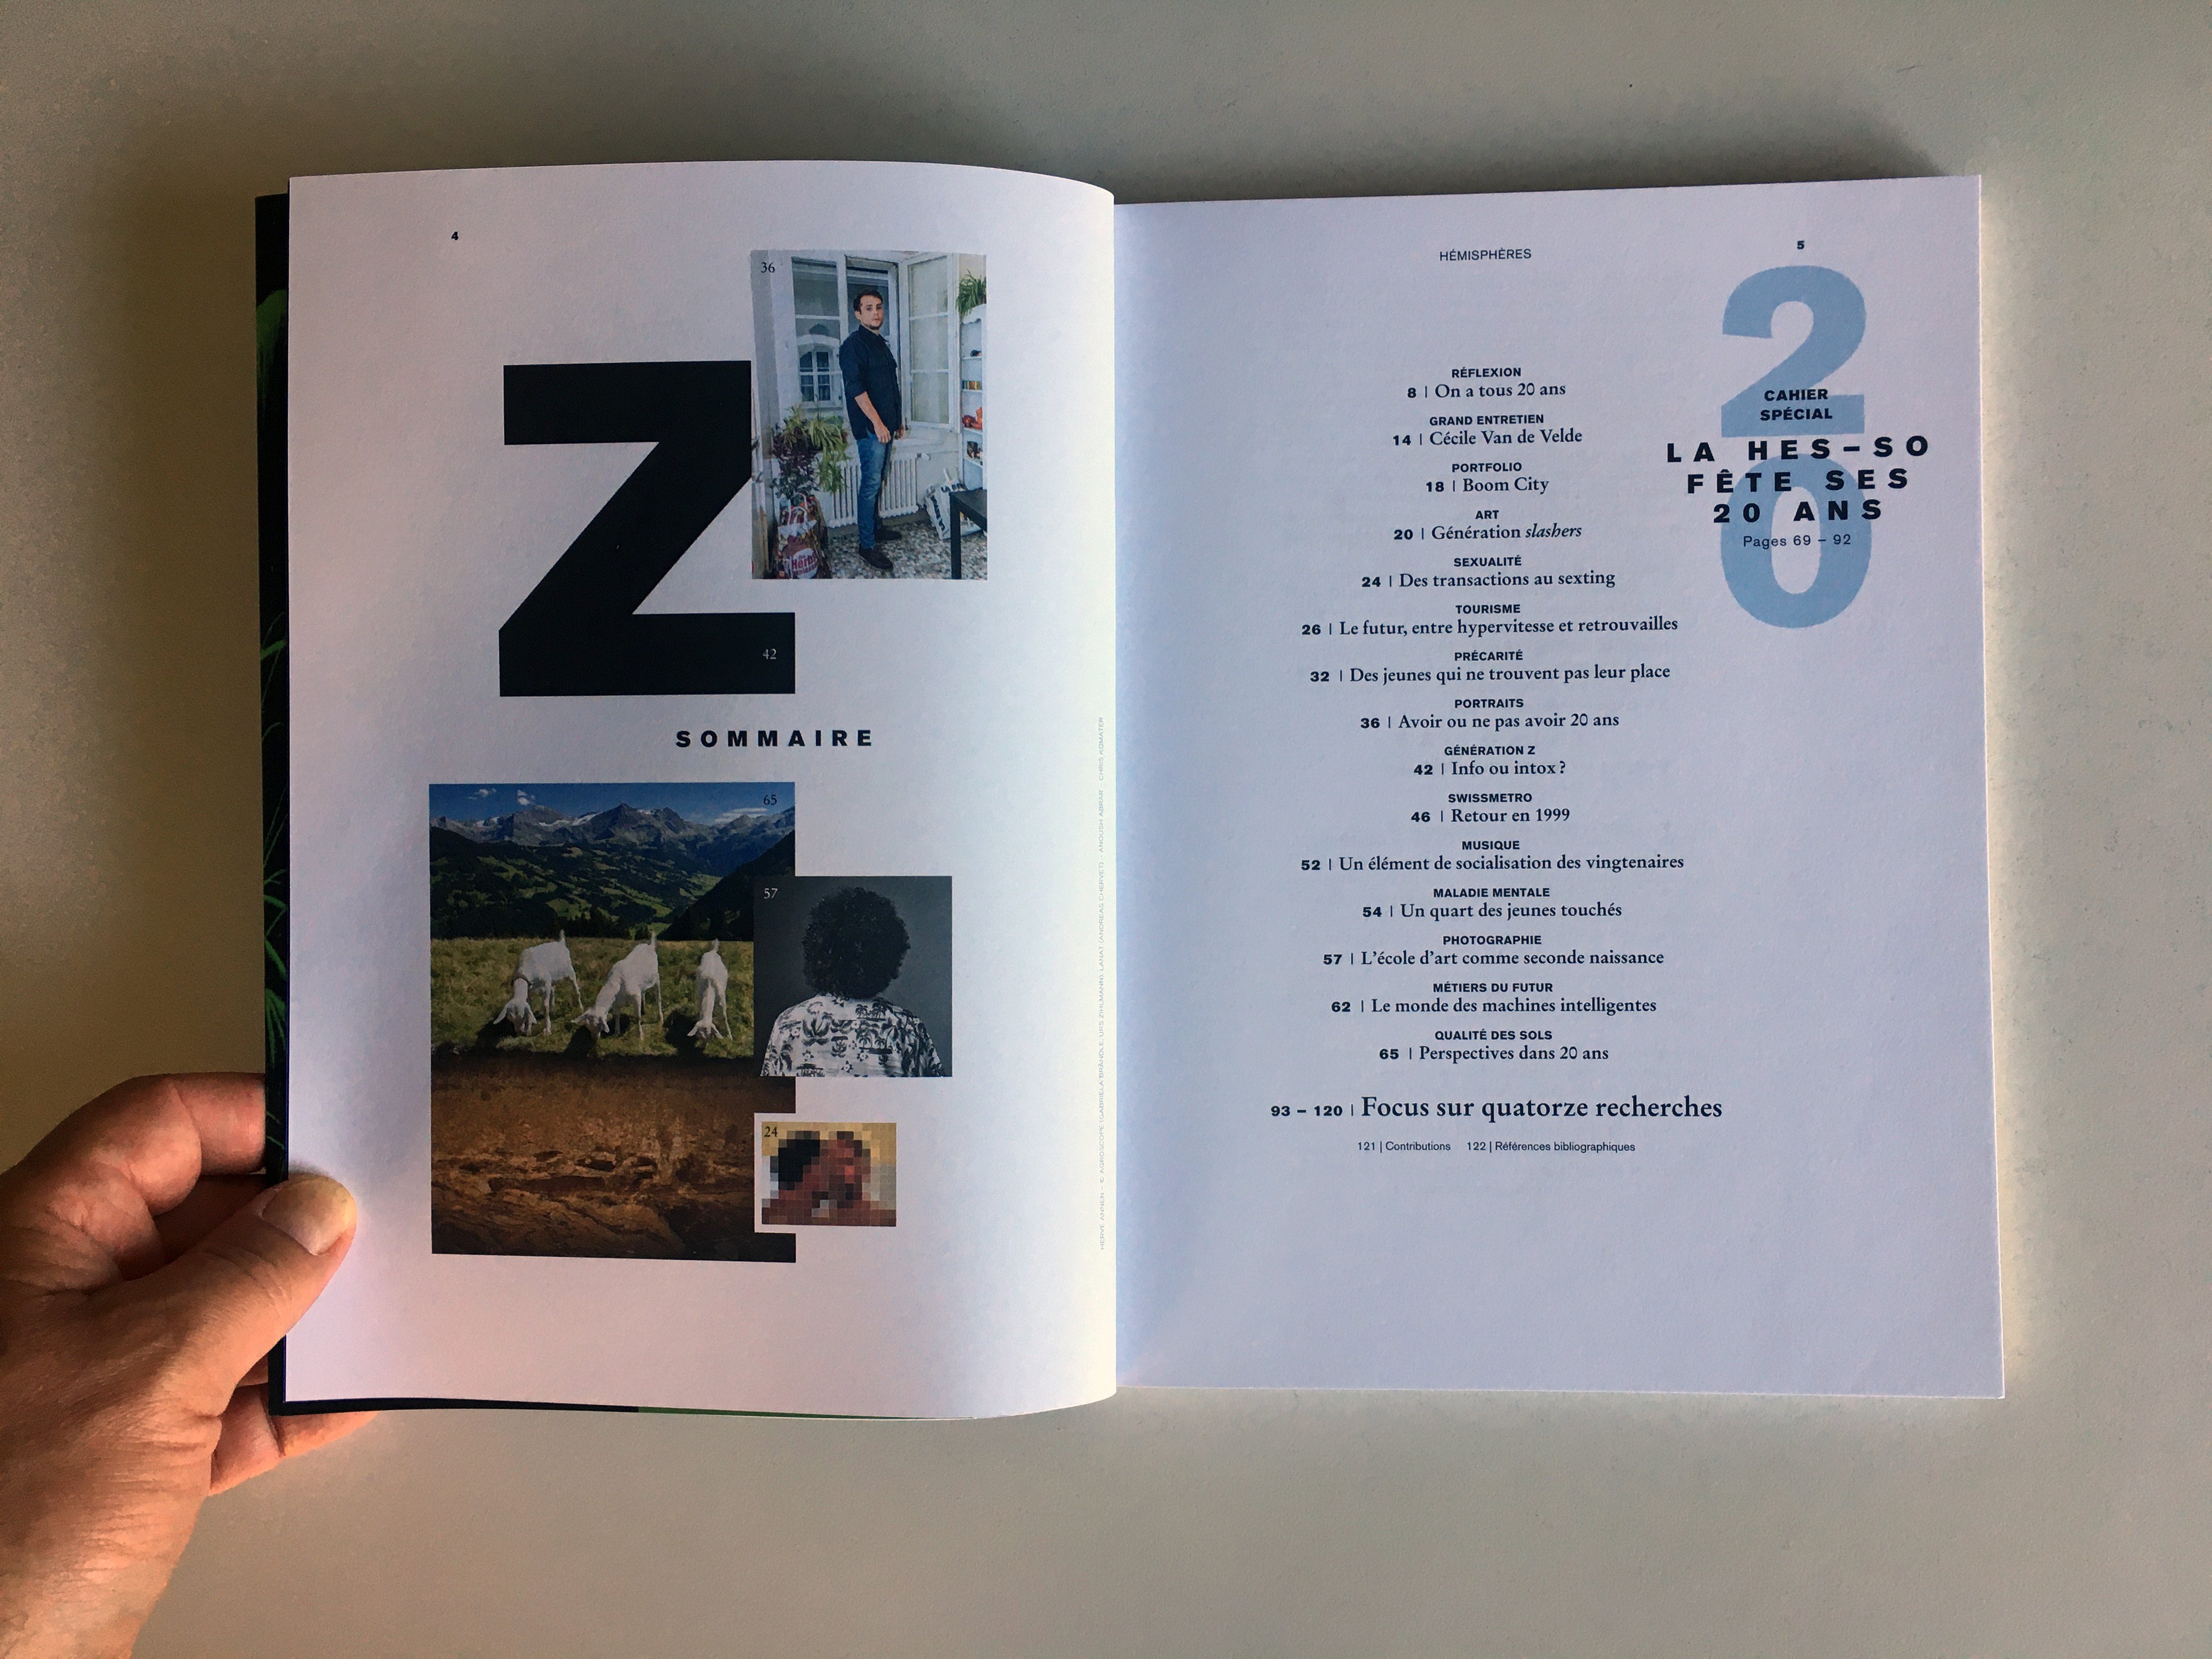
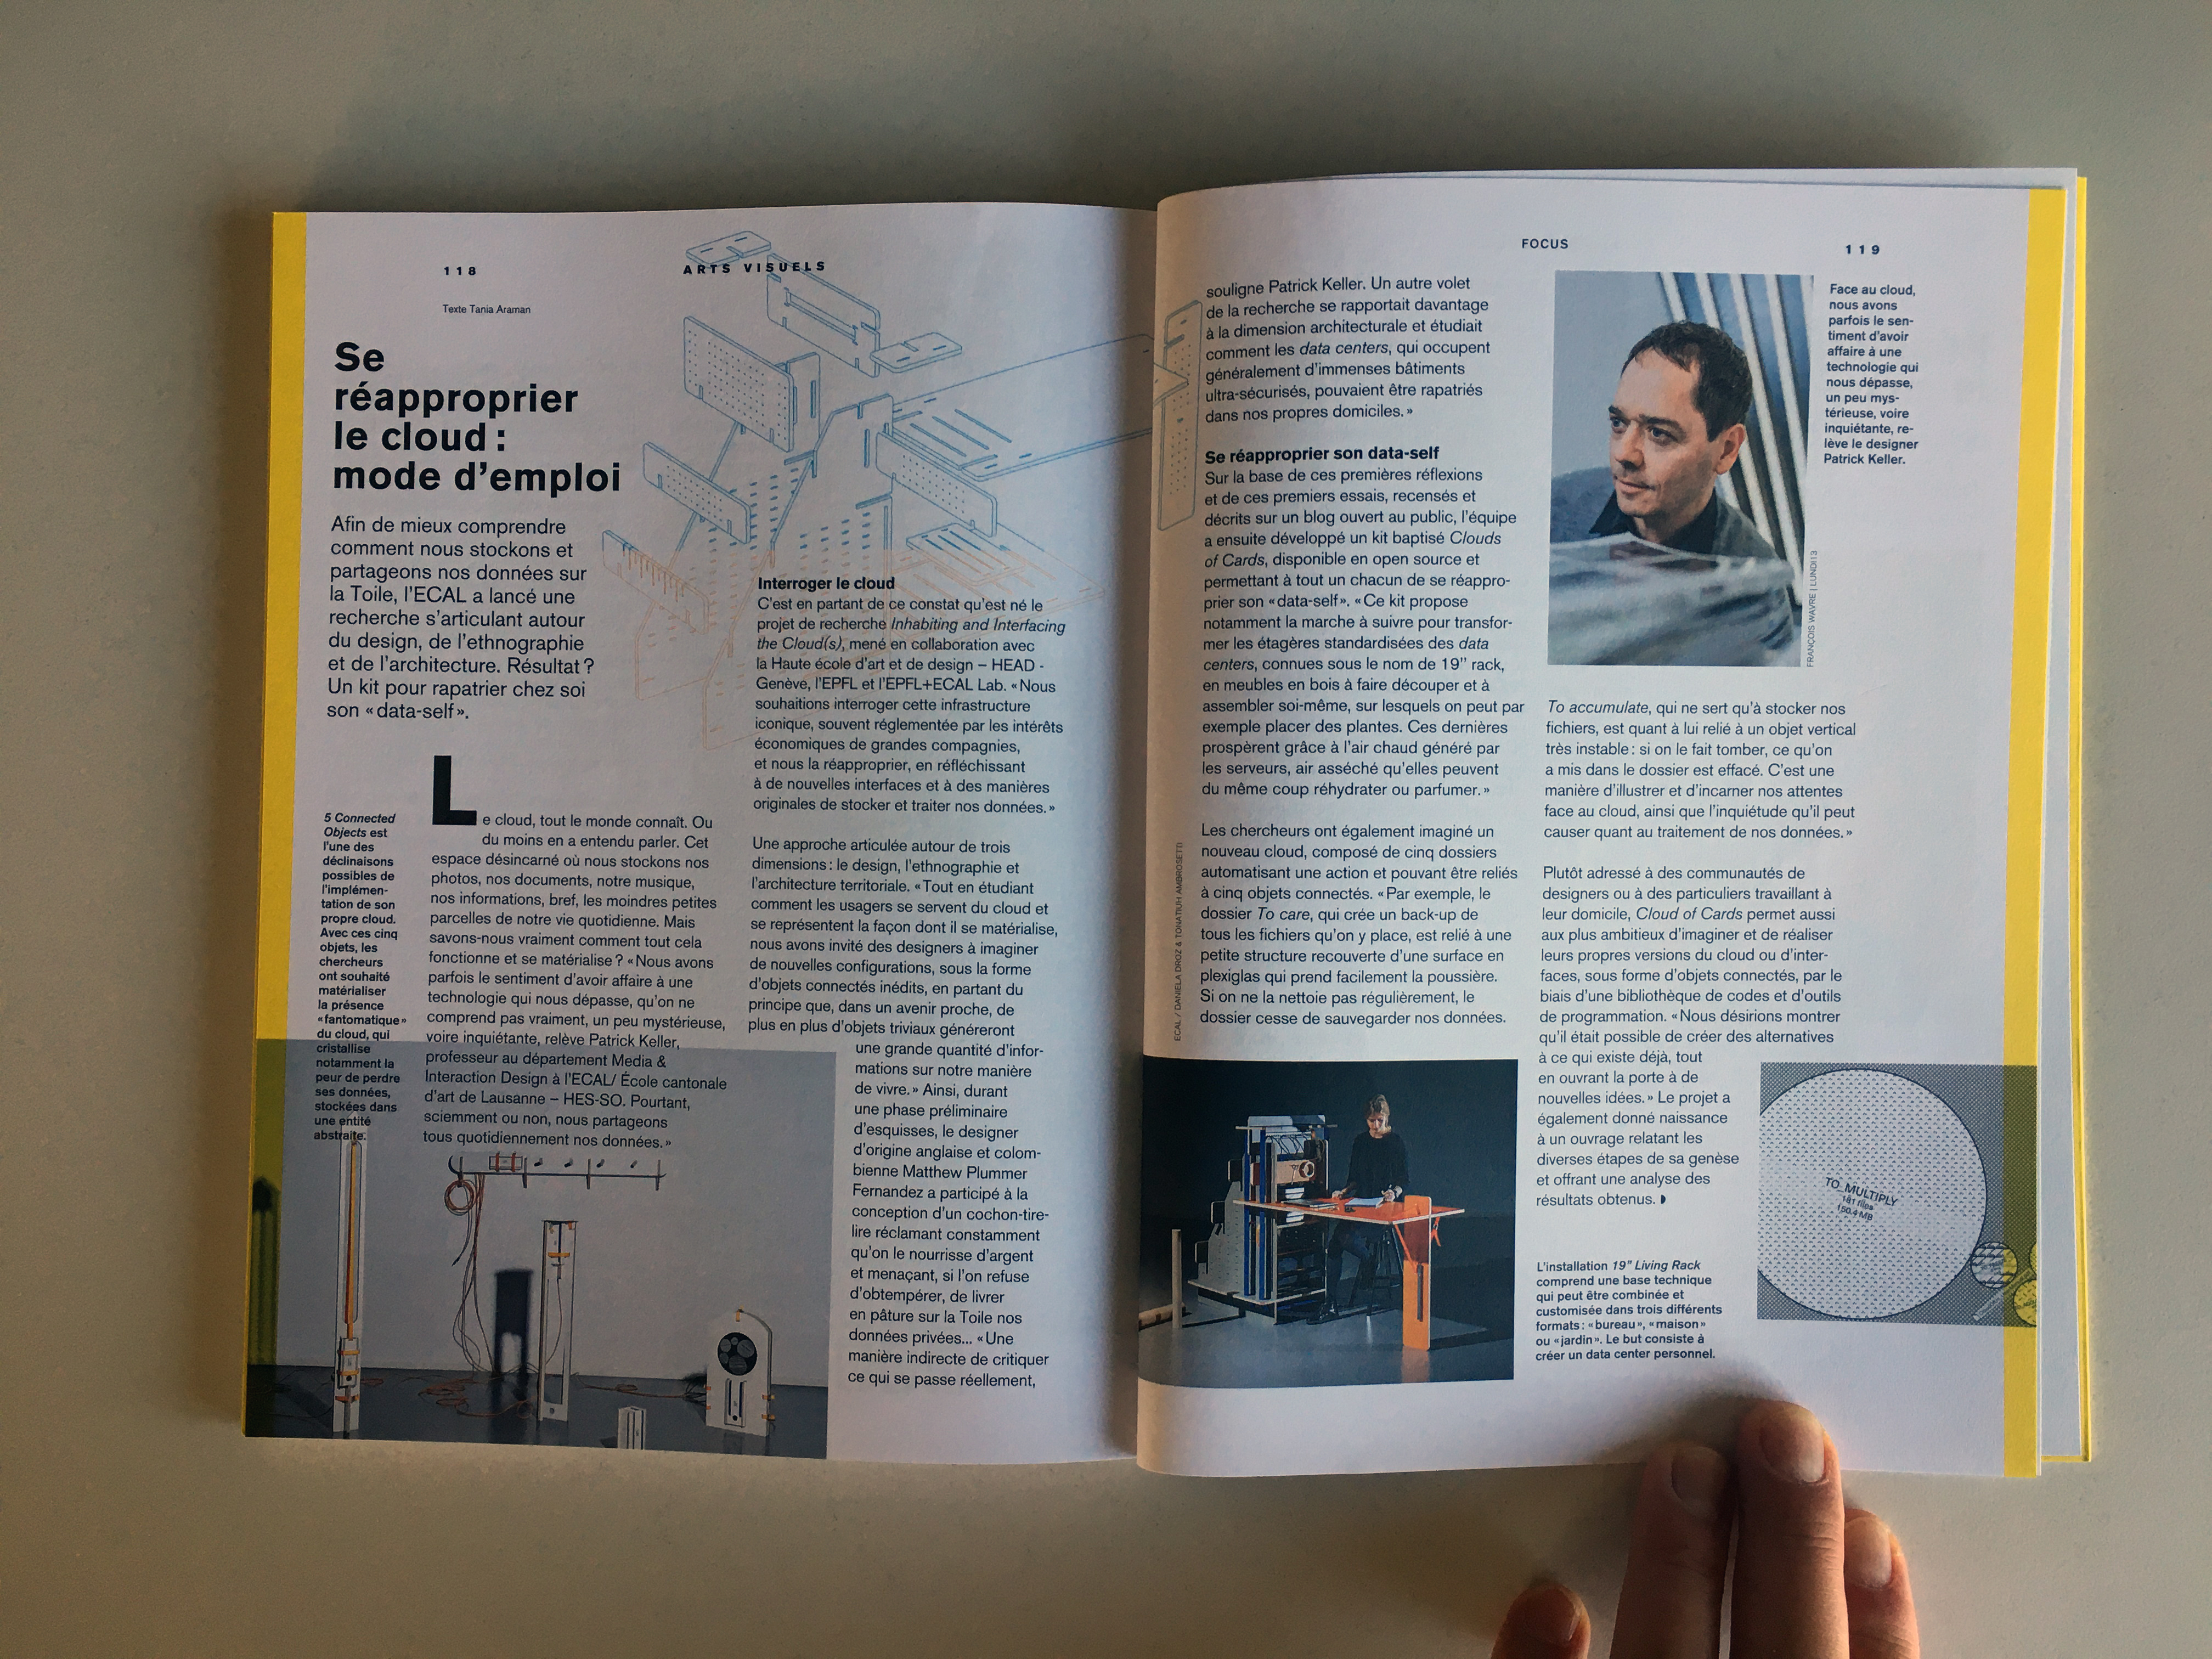
Note: still catching up on past publications, these ones (Cloud of Cards and related) are "pre-covid times", in Print-on-Demand and related to a the design research on data and the cloud led jointly between ECAL / University of Art & Design, Lausanne and HEAD - Genève (with Prof. Nicolas Nova). It concerns mainly new propositions for hosting infrastructure of data, envisioned as "personal", domestic (decentralized) and small scale alternatives. Many "recipes" were published to describe how to creatively hold you data yourself.
It can also be accessed through my academia account, along with it's accompanying publication by NIcolas Nova: Cloud of Practices.
-----
By Patrick Keller
--
The same research was shortly presented in the Swiss journal Hemispheres, as well as in the international magazine Frame:
Note: just after archiving the MOMA exhibition on | rblg, here comes a small post by Eliza Pertigkiozoglou about the Architecture Machine Group at MIT, same period somehow. This groundbreaking architecture teaching unit and research experience that then led to the MIT Media Lab (Beatriz Colomina spoke about it in its research about design teaching and "Radical Pedagogies" - we spoke about it already on | rblg in the context of a book about the Black Mountain College).
The post details Urban 5, one of the first project the group developed that was supposed to help (anybody) develop an architecture project, in an interactive way. This story is also very well explained and detailed by Orit Halpern in the recent book by CCA: When is the Digital in Architecture?
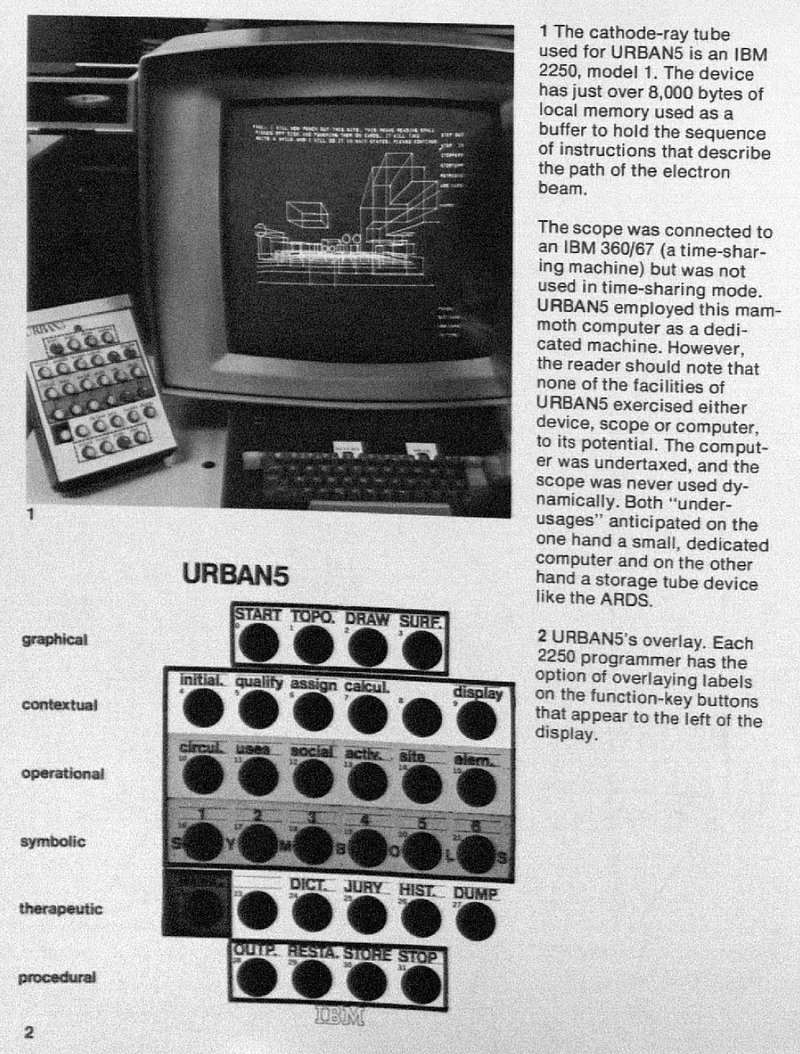
URBAN 5’s overlay and the IBM 2250 model 1 cathode ray-tube used for URBAN 5 (source: openarchitectures.com)
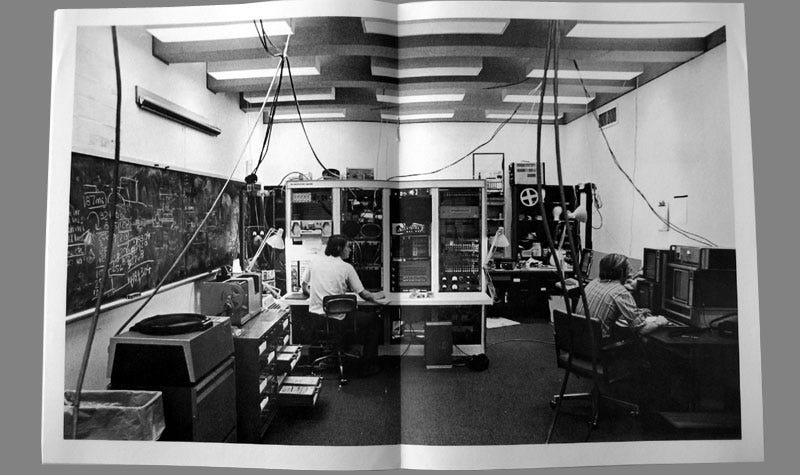
Nicholas Negroponte (1943) founded in 1967, together with Leon Groisser, the Architecture Machine Group (Arch Mac) at MIT, which later in 1985 transformed to MIT Media Lab. Negroponte’s vision was an architecture machine that would turn the design process into a dialogue, altering the traditional human-machine dynamics. His approach was significantly influenced by recent discussion on artificial intelligence, cybernetics, conversation theory, technologies for learning, sketch recognition and representation. Arch Mac laboratory combined architecture, engineering and computing to develop architectural applications and artificially intelligent interfaces that question the design process and the role of its actors.
The Architecture Machine’s computer and interface installation (source:radical-pedagogies.com)
Urban 5 was the first research project of the lab developed in 1973, as an improved version of Urban 2. Interestingly, in his book “Architecture Machine” Negroponte explains, evaluate and criticize Urban5, contemplating on the successes and insufficiencies of the program that aimed to serve as a “toy” for experimentation rather than a tool to handle real design problems. It was “a system that could monitor design procedures” and not design tool by itself. As explained in the book, Urban’s 5 original goal was to “study the desirability and feasibility of conversing with a machine about environmental design project… using the computer as an objective mirror of the user’s own design criteria and form decisions; reflecting formed from a larger information base than the user’s personal experience”.
Urban 5 communicated with the architect-user first by giving him instructions, then by learning from him and eventually by dialoguing with him. Two languages were employed for that communication: graphic language and English language. The graphic language was using the abstract representation of cubes (nouns). The English language was text appearing on the screen (verbs). The cubes could be added incrementally and had qualities, such as sunlight, visual and acoustical privacy, which could be explicitly assigned by the user or implicitly by the machine. When the user was first introduced to the software, the software was providing instructions. Then the user could could explicitly assign criteria or generate forms graphically in different contexts. What Negroponte called context was defined by mode, which referred to different display modes that allow the designer different kinds of operations. For example, in the TOPO mode the architect can manipulate topography in plan, while in the DRAW mode he/she can manipulate the viewing mode and the physical elements. In the final stage of this human-machine relationship there was a dialogue between designer and the computer :when there was an inconsistency between the assigned criteria and the generated form, the computer informed the architect and he/she could choose the next step: ignore, postpone, and alter the criterion or the form.
Source: The Architecture Machine, Negroponte
Negreponte’s criticism give an insight of Arch Mac’s explorations, goals and self-reflection on the research project. To Negroponte, Urban 5 insufficiency was summarized in four main points. First, it was based on assumptions of the design process that can be denuded: architecture is additive(accumulation of cubes), labels are symbols and design is non-deterministic. Also, it offered specific and predetermined design services. Although different combinations could produce numerous results, they were still finite. The designer has always to decide what should be the next step in the cross-reference between the contexts/modes, without any suggestion or feedback from the computer. Last point of his criticism was that Urban 5 interacts with only one designer and the interaction is strictly mediated through “a meager selection of communication artifacts”, meaning the keyboard and the screen. The medium and the language itself.
Although Urban 5 is a simple program with limited options, the points that are addressed are basically the constraints of current CAD programs. This is, up to an extent, expected, given the medium and the language frames the interaction between man and the machine.“The world view of culture is limited by the structure of the language which that culture uses.”(Whorf, 1956) The world view of a machine is similarly marked by linguistic structure”(1). Nevertheless, it seems that Negroponte’s and Arch Mac explorations were ahead of their time, offered an insight in human-machine design interactions, suggesting “true dialogue”. “Urban 5 suggests an evolutionary system, an intelligent system — but, in itself , is none of them”(2).
References:
(1),(2): Quotes of Negroponte from “The Architecture Machine” book -see below
-Negroponte Nicholas, The Architecture Machine: Towards a more human environment, MIT Press, 1970
- Wright Steenson Molly, Architectures of Information:Christofer Alexander, Cedric Price and Nicholas Negroponte & MIT’s Architecture Machine Group, Phd Thesis, Princeton, April 2014
Note: the title and beginning of the article is very promissing or teasing, so to say... But unfortunately not freely accessible without a subscription on the New Scientist. Yet as it promisses an interesting read, I do archive it on | rblg for record and future readings.
In the meantime, here's also an interesting interview (2010) from Vlatko, at the time when he published his book Decoding Reality () about Information with physicist Vlatko Vedral for The Guardian.
And an extract from the article on the New Scientist:
I’m building a machine that breaks the rules of reality
We thought only fools messed with the cast-iron laws of thermodynamics – but quantum trickery is rewriting the rulebook, says physicist Vladko Vedral.
Martin Leon Barreto
By Vlatko Vedral
A FEW years ago, I had an idea that may sound a little crazy: I thought I could see a way to build an engine that works harder than the laws of physics allow.
You would be within your rights to baulk at this proposition. After all, the efficiency of engines is governed by thermodynamics, the most solid pillar of physics. This is one set of natural laws you don’t mess with.
Yet if I leave my office at the University of Oxford and stroll down the corridor, I can now see an engine that pays no heed to these laws. It is a machine of considerable power and intricacy, with green lasers and ions instead of oil and pistons. There is a long road ahead, but I believe contraptions like this one will shape the future of technology.
Better, more efficient computers would be just the start. The engine is also a harbinger of a new era in science. To build it, we have had to uncover a field called quantum thermodynamics, one set to retune our ideas about why life, the universe – everything, in fact – are the way they are.
Thermodynamics is the theory that describes the interplay between temperature, heat, energy and work. As such, it touches on pretty much everything, from your brain to your muscles, car engines to kitchen blenders, stars to quasars. It provides a base from which we can work out what sorts of things do and don’t happen in the universe. If you eat a burger, you must burn off the calories – or …
"We found evolution will punish you if you're selfish and mean," said lead author Christoph Adami, MSU professor of microbiology and molecular genetics. "For a short time and against a specific set of opponents, some selfish organisms may come out ahead. But selfishness isn't evolutionarily sustainable."
The paper "Evolutionary instability of Zero Determinant strategies demonstrates that winning isn't everything," is co-authored by Arend Hintze, molecular and microbiology research associate, and published in the Aug. 1, 2013 issue of Nature Communications.
Game theory is used in biology, economics, political science and other disciplines. Much of the last 30 years of research has focused on how cooperation came to be, since it's found in many forms of life, from single-cell organisms to people.
Researchers use the prisoner's dilemma game as a model to study cooperation. In it, two people have committed a crime and are arrested. Police offer each person a deal: snitch on your friend and go free while the friend spends six months in jail. If both prisoners snitch, they both get three months in jail. If they both stay silent, they both get one month in jail for a lesser offense. If the two prisoners get a chance to talk to each other, they can establish trust and are usually more likely to cooperate because then both of them only spend one month in jail. But if they're not allowed to communicate, the best strategy is to snitch because it guarantees the snitcher doesn't get the longer jail term.
The game allows scientists to study a basic question faced by individuals competing for limited resources: do I act selfishly or do I cooperate? Cooperating would do the most good for the most individuals, but it might be tempting to be selfish and freeload, letting others do the work and take the risks.
In May 2012, two leading physicists published a paper showing their newly discovered strategy – called zero-determinant—gave selfish players a guaranteed way to beat cooperative players.
"The paper caused quite a stir," said Adami. "The main result appeared to be completely new, despite 30 years of intense research in this area."
Adami and Hintze had their doubts about whether following a zero determinant strategy (ZD) would essentially eliminate cooperation and create a world full of selfish beings. So they used high-powered computing to run hundreds of thousands of games and found ZD strategies can never be the product of evolution. While ZD strategies offer advantages when they're used against non-ZD opponents, they don't work well against other ZD opponents.
"In an evolutionary setting, with populations of strategies, you need extra information to distinguish each other," Adami explained.
So ZD strategies only worked if players knew who their opponents were and adapted their strategies accordingly. A ZD player would play one way against another ZD player and a different way against a cooperative player.
"The only way ZD strategists could survive would be if they could recognize their opponents," Hintze added. "And even if ZD strategists kept winning so that only ZD strategists were left, in the long run they would have to evolve away from being ZD and become more cooperative. So they wouldn't be ZD strategists anymore."
Both Adami and Hintze are members of the BEACON Center for the Study of Evolution in Action, a National Science Foundation Center that brings together biologists, computer scientists, engineers and researchers from other disciplines to study evolution as it happens.
The research also makes that case that communication and information are necessary for cooperation to take place.
"Standard game theory doesn't take communication into account because it's so complicated to do the math for the expected payoffs," Adami explained. "But just because the math doesn't exist and the general formula may never be solved, it doesn't mean we can't explore the idea using agent-based modeling. Communication is critical for cooperation; we think communication is the reason cooperation occurs. It's generally believed that there are five independent mechanisms that foster cooperation. But these mechanisms are really just ways to ensure that cooperators play mostly with other cooperators and avoid all others. Communication is a universal way to achieve that. We plan to test the idea directly in yeast cells."
Enhancing the flow of information through the brain could be crucial to making neuroprosthetics practical.
The abilities to learn, remember, evaluate, and decide are central to who we are and how we live. Damage to or dysfunction of the brain circuitry that supports these functions can be devastating, leading to Alzheimer’s, schizophrenia, PTSD, or many other disorders. Current treatments, which are drug-based or behavioral, have limited efficacy in treating these problems. There is a pressing need for something more effective.
One promising approach is to build an interactive device to help the brain learn, remember, evaluate, and decide. One might, for example, construct a system that would identify patterns of brain activity tied to particular experiences and then, when called upon, impose those patterns on the brain. Ted Berger, Sam Deadwyler, Robert Hampsom, and colleagues have used this approach (see “Memory Implants”). They are able to identify and then impose, via electrical stimulation, specific patterns of brain activity that improve a rat’s performance in a memory task. They have also shown that in monkeys stimulation can help the animal perform a task where it must remember a particular item.
Their ability to improve performance is impressive. However, there are fundamental limitations to an approach where the desired neural pattern must be known and then imposed. The animals used in their studies were trained to do a single task for weeks or months and the stimulation was customized to produce the right outcome for that task. This is only feasible for a few well-learned experiences in a predictable and constrained environment.
New and complex experiences engage large numbers of neurons scattered across multiple brain regions. These individual neurons are physically adjacent to other neurons that contribute to other memories, so selectively stimulating the right neurons is difficult if not impossible. And to make matters even more challenging, the set of neurons involved in storing a particular memory can evolve as that memory is processed in the brain. As a result, imposing the right patterns for all desired experiences, both past and future, requires technology far beyond what is possible today.
I believe the answer to be an alternative approach based on enhancing flows of information through the brain. The importance of information flow can be appreciated when we consider how the brain makes and uses memories. During learning, information from the outside world drives brain activity and changes in the connections between neurons. This occurs most prominently in the hippocampus, a brain structure critical for laying down memories for the events of daily life. Thus, during learning, external information must flow to the hippocampus if memories are to be stored.
Once information has been stored in the hippocampus, a different flow of information is required to create a long-lasting memory. During periods of rest and sleep, the hippocampus “reactivates” stored memories, driving activity throughout the rest of the brain. Current theories suggest that the hippocampus acts like a teacher, repeatedly sending out what it has learned to the rest of the brain to help engrain memories in more stable and distributed brain networks. This “consolidation” process depends on the flow of internal information from the hippocampus to the rest of the brain.
Finally, when a memory is retrieved a similar pattern of internally driven flow is required. For many memories, the hippocampus is required for memory retrieval, and once again hippocampal activity drives the reinstatement of the memory pattern throughout the brain. This process depends on the same hippocampal reactivation events that contribute to memory consolidation.
Different flows of information can be engaged at different intensities as well. Some memories stay with us and guide our choices for a lifetime, while others fade with time. We and others have shown that new and rewarded experiences drive both profound changes in brain activity, and strong memory reactivation. Familiar and unrewarded experiences drive smaller changes and weaker reactivation. Further, we have recently shown that the intensity of memory reactivation in the hippocampus, measured as the number of neurons active together during each reactivation event, can predict whether an the next decision an animal makes is going to be right or wrong. Our findings suggest that when the animal reactivates effectively, it does a better job of considering possible future options (based on past experiences) and then makes better choices.
These results point to an alternative approach to helping the brain learn, remember and decide more effectively. Instead of imposing a specific pattern for each experience, we could enhance the flow of information to the hippocampus during learning and the intensity of memory reactivation from the hippocampus during memory consolidation and retrieval. We are able to detect signatures of different flows of information associated with learning and remembering. We are also beginning to understand the circuits that control this flow, which include neuromodulatory regions that are often damaged in disease states. Importantly, these modulatory circuits are more localized and easier to manipulate than the distributed populations of neurons in the hippocampus and elsewhere that are activated for each specific experience.
Thus, an effective cognitive neuroprosthetic would detect what the brain is trying to do (learn, consolidate or retrieve) and then amplify activity in the relevant control circuits to enhance the essential flows of information. We know that even in diseases like Alzheimer’s where there is substantial damage to the brain, patients have good days and bad days. On good days the brain smoothly transitions among distinct functions, each associated with a particular flow of information. On bad days these functions may become less distinct and the flows of information muddled. Our goal then, would be to restore the flows of information underlying different mental functions.
A prosthetic device has the potential to adapt to the moment-by-moment changes in information flow necessary for different types of mental processing. By contrast, drugs that seek to treat cognitive dysfunction may effectively amplify one type of processing but cannot adapt to the dynamic requirements of mental function. Thus, constructing a device that makes the brain’s control circuits work more effectively offers a powerful approach to treating disease and maximizing mental capacity.
Loren M. Frank is a professor at the Center for Integrative Neuroscience and the Department of Physiology at the University of California, San Francisco.
Storing video and other files more intelligently reduces the demand on servers in a data center.
Worldwide, data centers consume huge and growing amounts of electricity.
New research suggests that data centers could significantly cut their electricity usage simply by storing fewer copies of files, especially videos.
For now the work is theoretical, but over the next year, researchers at Alcatel-Lucent’s Bell Labs and MIT plan to test the idea, with an eye to eventually commercializing the technology. It could be implemented as software within existing facilities. “This approach is a very promising way to improve the efficiency of data centers,” says Emina Soljanin, a researcher at Bell Labs who participated in the work. “It is not a panacea, but it is significant, and there is no particular reason that it couldn’t be commercialized fairly quickly.”
With the new technology, any individual data center could be expected to save 35 percent in capacity and electricity costs—about $2.8 million a year or $18 million over the lifetime of the center, says Muriel Médard, a professor at MIT’s Research Laboratory of Electronics, who led the work and recently conducted the cost analysis.
So-called storage area networks within data center servers rely on a tremendous amount of redundancy to make sure that downloading videos and other content is a smooth, unbroken experience for consumers. Portions of a given video are stored on different disk drives in a data center, with each sequential piece cued up and buffered on your computer shortly before it’s needed. In addition, copies of each portion are stored on different drives, to provide a backup in case any single drive is jammed up. A single data center often serves millions of video requests at the same time.
The new technology, called network coding, cuts way back on the redundancy without sacrificing the smooth experience. Algorithms transform the data that makes up a video into a series of mathematical functions that can, if needed, be solved not just for that piece of the video, but also for different parts. This provides a form of backup that doesn’t rely on keeping complete copies of the data. Software at the data center could simply encode the data as it is stored and decode it as consumers request it.
Médard’s group previously proposed a similar technique for boosting wireless bandwidth (see “A Bandwidth Breakthrough”). That technology deals with a different problem: wireless networks waste a lot of bandwidth on back-and-forth traffic to recover dropped portions of a signal, called packets. If mathematical functions describing those packets are sent in place of the packets themselves, it becomes unnecessary to re-send a dropped packet; a mobile device can solve for the missing packet with minimal processing. That technology, which improves capacity up to tenfold, is currently being licensed to wireless carriers, she says.
Between the electricity needed to power computers and the air conditioning required to cool them, data centers worldwide consume so much energy that by 2020 they will cause more greenhouse-gas emissions than global air travel, according to the consulting firm McKinsey.
Smarter software to manage them has already proved to be a huge boon (see “A New Net”). Many companies are building data centers that use renewable energy and smarter energy management systems (see “The Little Secrets Behind Apple’s Green Data Centers”). And there are a number of ways to make chips and software operate more efficiently (see “Rethinking Energy Use in Data Centers”). But network coding could make a big contribution by cutting down on the extra disk drives—each needing energy and cooling—that cloud storage providers now rely on to ensure reliability.
This is not the first time that network coding has been proposed for data centers. But past work was geared toward recovering lost data. In this case, Médard says, “we have considered the use of coding to improve performance under normal operating conditions, with enhanced reliability a natural by-product.”
Personal comment:
Still a link in the context of our workshop at the Tsinghua University and related to data storage at large.
The link between energy, algorithms and data storage made obvious. To be read in parallel with the previous repost from Kazys Varnelis, Into the Cloud (with zombies). -
In the same idea, another piece of code that could cut flight delays and therefore cut approx $1.2 million in annual crew costs and $5 million in annual fuel savings to a midsized airline...
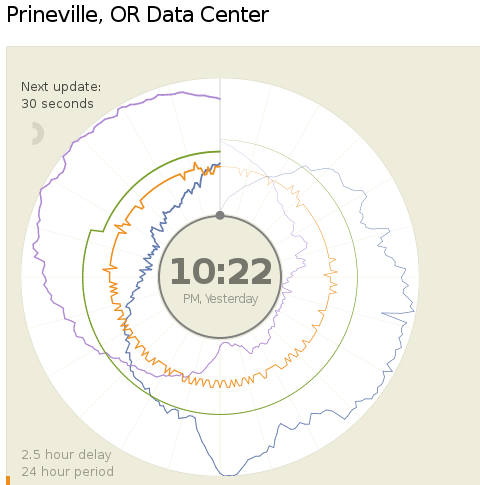
Today (18.04.2013) Facebook launched two public dashboards that report continuous, near-real-time data for key efficiency metrics – specifically, PUE and WUE – for our data centers in Prineville, OR and Forest City, NC. These dashboards include both a granular look at the past 24 hours of data and a historical view of the past year’s values. In the historical view, trends within each data set and correlations between different metrics become visible. Once our data center in Luleå, Sweden, comes online, we’ll begin publishing for that site as well.
We began sharing PUE for our Prineville data center at the end of Q2 2011 and released our first Prineville WUE in the summer of 2012. Now we’re pulling back the curtain to share some of the same information that our data center technicians view every day. We’ll continue updating our annualized averages as we have in the past, and you’ll be able to find them on the Prineville and Forest City dashboards, right below the real-time data.
Why are we doing this? Well, we’re proud of our data center efficiency, and we think it’s important to demystify data centers and share more about what our operations really look like. Through the Open Compute Project (OCP), we’ve shared the building and hardware designs for our data centers. These dashboards are the natural next step, since they answer the question, “What really happens when those servers are installed and the power’s turned on?”
Creating these dashboards wasn’t a straightforward task. Our data centers aren’t completed yet; we’re still in the process of building out suites and finalizing the parameters for our building managements systems. All our data centers are literally still construction sites, with new data halls coming online at different points throughout the year. Since we’ve created dashboards that visualize an environment with so many shifting variables, you’ll probably see some weird numbers from time to time. That’s OK. These dashboards are about surfacing raw data – and sometimes, raw data looks messy. But we believe in iteration, in getting projects out the door and improving them over time. So we welcome you behind the curtain, wonky numbers and all. As our data centers near completion and our load evens out, we expect these inevitable fluctuations to correspondingly decrease.
We’re excited about sharing this data, and we encourage others to do the same. Working together with AREA 17, the company that designed these visualizations, we’ve decided to open-source the front-end code for these dashboards so that any organization interested in sharing PUE, WUE, temperature, and humidity at its data center sites can use these dashboards to get started. Sometime in the coming weeks we’ll publish the code on the Open Compute Project’s GitHub repository. All you have to do is connect your own CSV files to get started. And in the spirit of all other technologies shared via OCP, we encourage you to poke through the code and make updates to it. Do you have an idea to make these visuals even more compelling? Great! We encourage you to treat this as a starting point and use these dashboards to make everyone’s ability to share this data even more interesting and robust.
Lyrica McTiernan is a program manager for Facebook’s sustainability team.
Personal comment:
The Open Compute Project is definitely an interesting one and the fact that it comes with open data about centers' consumption as well. Though, PUE and WUE should be questioned further to know if these are the right measures about the effectiveness of a data center.
I'm not a specialist here, but It seems to me that these values don't give an idea of the overall use of energy for a dedicated task (data and services hosting, remote computing), but just how efficient the center is (if it makes a good use or not or energy and water).
To resume it: I could spend a super large amount of energy and water, but if I do it in an efficient way, then my pue and wue will good and it will look ok on the paper and for the brand communication.
That's certainly a good start (better have a good pue and wue) and in fact all factories should publish such numbers, but it is probably not enough. How much energy for what type of service might or should become a crucial question in a close future, until we'll have an "abundance" of renewable ones!
Note: I'm again here joining two recent posts. First, what it could climatically and therefore spatially, geographically, energetically, socialy, ... mean, degree after degree to increase the average temperature of the Earth and second, an information map about our warming world...
It is an unsigned paper, so it certainly need to be cross-checked, which I haven't done (time, time...)! But I post it nevertheless as it points out some believable consequences, yet very dark. As many people say now, we don't have much time left to start acting, strong (7-10 years).
A degree by degree explanation of what will happen when the earth warms
-
Even if greenhouse emissions stopped overnight the concentrations already in the atmosphere would still mean a global rise of between 0.5 and 1C. A shift of a single degree is barely perceptible to human skin, but it’s not human skin we’re talking about. It’s the planet; and an average increase of one degree across its entire surface means huge changes in climatic extremes.
Six thousand years ago, when the world was one degree warmer than it is now, the American agricultural heartland around Nebraska was desert. It suffered a short reprise during the dust- bowl years of the 1930s, when the topsoil blew away and hundreds of thousands of refugees trailed through the dust to an uncertain welcome further west. The effect of one-degree warming, therefore, requires no great feat of imagination.
“The western United States once again could suffer perennial droughts, far worse than the 1930s. Deserts will reappear particularly in Nebraska, but also in eastern Montana, Wyoming and Arizona, northern Texas and Oklahoma. As dust and sandstorms turn day into night across thousands of miles of former prairie, farmsteads, roads and even entire towns will be engulfed by sand.”
What’s bad for America will be worse for poorer countries closer to the equator. It has beencalculated that a one-degree increase would eliminate fresh water from a third of the world’s land surface by 2100. Again we have seen what this means. There was an incident in the summer of 2005: One tributary fell so low that miles of exposed riverbank dried out into sand dunes, with winds whipping up thick sandstorms. As desperate villagers looked out onto baking mud instead of flowing water, the army was drafted in to ferry precious drinking water up the river – by helicopter, since most of the river was too low to be navigable by boat. The river in question was not some small, insignificant trickle in Sussex. It was the Amazon.
While tropical lands teeter on the brink, the Arctic already may have passed the point of no return. Warming near the pole is much faster than the global average, with the result that Arctic icecaps and glaciers have lost 400 cubic kilometres of ice in 40 years. Permafrost – ground that has lain frozen for thousands of years – is dissolving into mud and lakes, destabilising whole areas as the ground collapses beneath buildings, roads and pipelines. As polar bears and Inuits are being pushed off the top of the planet, previous predictions are starting to look optimistic. Earlier snowmelt means more summer heat goes into the air and ground rather than into melting snow, raising temperatures in a positive feedback effect. More dark shrubs and forest on formerly bleak tundra means still more heat is absorbed by vegetation.
Out at sea the pace is even faster. Whilst snow-covered ice reflects more than 80% of the sun’s heat, the darker ocean absorbs up to 95% of solar radiation. Once sea ice begins to melt, in other words, the process becomes self-reinforcing. More ocean surface is revealed, absorbing solar heat, raising temperatures and making it unlikelier that ice will re-form next winter. The disappearance of 720,000 square kilometres of supposedly permanent ice in a single year testifies to the rapidity of planetary change. If you have ever wondered what it will feel like when the Earth crosses a tipping point, savour the moment.
Mountains, too, are starting to come apart. In the Alps, most ground above 3,000 metres is stabilised by permafrost. In the summer of 2003, however, the melt zone climbed right up to 4,600 metres, higher than the summit of the Matterhorn and nearly as high as Mont Blanc. With the glue of millennia melting away, rocks showered down and 50 climbers died. As temperatures go on edging upwards, it won’t just be mountaineers who flee. Whole towns and villages will be at risk. Some towns, like Pontresina in eastern Switzerland, have already begun building bulwarks against landslides.
At the opposite end of the scale, low-lying atoll countries such as the Maldives will be preparing for extinction as sea levels rise, and mainland coasts – in particular the eastern US and Gulf of Mexico, the Caribbean and Pacific islands and the Bay of Bengal – will be hit by stronger and stronger hurricanes as the water warms. Hurricane Katrina, which in 2005 hit New Orleans with the combined impacts of earthquake and flood, was a nightmare precursor of what the future holds.
Most striking of all was seeing how people behaved once the veneer of civilisation had been torn away. Most victims were poor and black, left to fend for themselves as the police either joined in the looting or deserted the area. Four days into the crisis, survivors were packed into the city’s Superdome, living next to overflowing toilets and rotting bodies as gangs of young men with guns seized the only food and water available. Perhaps the most memorable scene was a single military helicopter landing for just a few minutes, its crew flinging food parcels and water bottles out onto the ground before hurriedly taking off again as if from a war zone. In scenes more like a Third World refugee camp than an American urban centre, young men fought for the water as pregnant women and the elderly looked on with nothing. Don’t blame them for behaving like this, I thought. It’s what happens when people are desperate.
Chance of avoiding one degree of global warming: zero.
BETWEEN ONE AND TWO DEGREES OF WARMING
At this level, expected within 40 years, the hot European summer of 2003 will be the annual norm. Anything that could be called a heatwave thereafter will be of Saharan intensity. Even in average years, people will die of heat stress.
The first symptoms may be minor. A person will feel slightly nauseous, dizzy and irritable. It needn’t be an emergency: an hour or so lying down in a cooler area, sipping water, will cure it. But in Paris, August 2003, there were no cooler areas, especially for elderly people.
Once body temperature reaches 41C (104F) its thermoregulatory system begins to break down. Sweating ceases and breathing becomes shallow and rapid. The pulse quickens, and the victim may lapse into a coma. Unless drastic measures are taken to reduce the body’s core temperature, the brain is starved of oxygen and vital organs begin to fail. Death will be only minutes away unless the emergency services can quickly get the victim into intensive care.
These emergency services failed to save more than 10,000 French in the summer of 2003. Mortuaries ran out of space as hundreds of dead bodies were brought in each night. Across Europe as a whole, the heatwave is believed to have cost between 22,000 and 35,000 lives. Agriculture, too, was devastated. Farmers lost $12 billion worth of crops, and Portugal alone suffered $12 billion of forest-fire damage. The flows of the River Po in Italy, Rhine in Germany and Loire in France all shrank to historic lows. Barges ran aground, and there was not enough water for irrigation and hydroelectricity. Melt rates in the Alps, where some glaciers lost 10% of their mass, were not just a record – they doubled the previous record of 1998. According to the Hadley centre, more than half the European summers by 2040 will be hotter than this. Extreme summers will take a much heavier toll of human life, with body counts likely to reach hundreds of thousands. Crops will bake in the fields, and forests will die off and burn. Even so, the short-term effects may not be the worst:
From the beech forests of northern Europe to the evergreen oaks of the Mediterranean, plant growth across the whole landmass in 2003 slowed and then stopped. Instead of absorbing carbon dioxide, the stressed plants began to emit it. Around half a billion tonnes of carbon was added to the atmosphere from European plants, equivalent to a twelfth of global emissions from fossil fuels. This is a positive feedback of critical importance, because it suggests that, as temperatures rise, carbon emissions from forests and soils will also rise. If these land-based emissions are sustained over long periods, global warming could spiral out of control.
In the two-degree world, nobody will think of taking Mediterranean holidays. The movement of people from northern Europe to the Mediterranean is likely to reverse, switching eventually into a mass scramble as Saharan heatwaves sweep across the Med. People everywhere will think twice about moving to the coast. When temperatures were last between 1 and 2C higher than they are now, 125,000 years ago, sea levels were five or six metres higher too. All this “lost” water is in the polar ice that is now melting. Forecasters predict that the “tipping point” for Greenland won’t arrive until average temperatures have risen by 2.7C. The snag is that Greenland is warming much faster than the rest of the world – 2.2 times the global average. “Divide one figure by the other,” says Lynas, “and the result should ring alarm bells across the world. Greenland will tip into irreversible melt once global temperatures rise past a mere 1.2C. The ensuing sea-level ?rise will be far more than the half-metre that ?the IPCC has predicted for the end of the century. Scientists point out that sea levels at the end of the last ice age shot up by a metre every 20 years for four centuries, and that Greenland’s ice, in the words of one glaciologist, is now thinning like mad and flowing much faster than it ought to. Its biggest outflow glacier, Jakobshavn Isbrae, has thinned by 15 metres every year since 1997, and its speed of flow has doubled. At this rate the whole Greenland ice sheet would vanish within 140 years. Miami would disappear, as would most of Manhattan. Central London would be flooded. Bangkok, Bombay and Shanghai would lose most of their area. In all, half of humanity would have to move to higher ground.
Not only coastal communities will suffer. As mountains lose their glaciers, so people will lose their water supplies. The entire Indian subcontinent will be fighting for survival. As the glaciers disappear from all but the highest peaks, their runoff will cease to power the massive rivers that deliver vital freshwater to hundreds of millions. Water shortages and famine will be the result, destabilising the entire region. And this time the epicentre of the disaster won’t be India, Nepal or Bangladesh, but nuclear-armed Pakistan.
Everywhere, ecosystems will unravel as species either migrate or fall out of synch with each other. By the time global temperatures reach two degrees of warming in 2050, more than a third of all living species will face extinction.
Chance of avoiding two degrees of global warming: 93%, but only if emissions of greenhouse gases are reduced by 60% over the next 10 years.
BETWEEN TWO AND THREE DEGREES OF WARMING
Up to this point, assuming that governments have planned carefully and farmers have converted to more appropriate crops, not too many people outside subtropical Africa need have starved. Beyond two degrees, however, preventing mass starvation will be as easy as halting the cycles of the moon. First millions, then billions, of people will face an increasingly tough battle to survive.
To find anything comparable we have to go back to the Pliocene – last epoch of the Tertiary period, 3m years ago. There were no continental glaciers in the northern hemisphere (trees grew in the Arctic), and sea levels were 25 metres higher than today’s. In this kind of heat, the death of the Amazon is as inevitable as the melting of Greenland. The paper spelling it out is the very one whose apocalyptic message so shocked in 2000. Scientists at the Hadley centre feared that earlier climate models, which showed global warming as a straightforward linear progression, were too simplistic in their assumption that land and the oceans would remain inert as their temperatures rose. Correctly as it would turn out, they predicted positive feedback.
Warmer seas absorb less carbon dioxide, leaving more to accumulate in the atmosphere and intensify global warming. On land, matters would be even worse. Huge amounts of carbon are stored in the soil, the half-rotted remains of dead vegetation. The generally accepted estimate is that the soil carbon reservoir contains some 1600 gigatonnes, more than double the entire carbon content of the atmosphere. As soil warms, bacteria accelerate the breakdown of this stored carbon, releasing it into the atmosphere.
The end of the world is nigh. A three-degree increase in global temperature – possible as early as 2050 – would throw the carbon cycle into reverse. Instead of absorbing carbon dioxide, vegetation and soils start to release it. So much carbon pours into the atmosphere that it pumps up atmospheric concentrations by 250 parts per million by 2100, boosting global warming by another 1.5C. In other words, the Hadley team had discovered that carbon-cycle feedbacks could tip the planet into runaway global warming by the middle of this century – much earlier than anyone had expected.
Confirmation came from the land itself. Climate models are routinely tested against historical data. In this case, scientists checked 25 years’ worth of soil samples from 6,000 sites across the UK. The result was another black joke. As temperatures gradually rose the scientists found that huge amounts of carbon had been released naturally from the soils. They totted it all up and discovered – irony of ironies – that the 13m tonnes of carbon British soils were emitting annually was enough to wipe out all the country’s efforts to comply with the Kyoto Protocol.” All soils will be affected by the rising heat, but none as badly as the Amazon’s. “Catastrophe” is almost too small a word for the loss of the rainforest. Its 7m square kilometres produce 10% of the world’s entire photosynthetic output from plants. Drought and heat will cripple it; fire will finish it off. In human terms, the effect on the planet will be like cutting off oxygen during an asthma attack.
In the US and Australia, people will curse the climate-denying governments of Bush and Howard. No matter what later administrations may do, it will not be enough to keep the mercury down. With new “super-hurricanes” growing from the warming sea, Houston could be destroyed by 2045, and Australia will be a death trap. “Farming and food production will tip into irreversible decline. Salt water will creep up the stricken rivers, poisoning ground water. Higher temperatures mean greater evaporation, further drying out vegetation and soils, and causing huge losses from reservoirs. In state capitals, heat every year is likely to kill between 8,000 and 15,000 mainly elderly people.
It is all too easy to visualise what will happen in Africa. In Central America, too, tens of millions will have little to put on their tables. Even a moderate drought there in 2001 meant hundreds of thousands had to rely on food aid. This won’t be an option when world supplies are stretched to breaking point (grain yields decline by 10% for every degree of heat above 30C, and at 40C they are zero). Nobody need look to the US, which will have problems of its own. As the mountains lose their snow, so cities and farms in the west will lose their water and dried-out forests and grasslands will perish at the first spark.
The Indian subcontinent meanwhile will be choking on dust. All of human history shows that, given the choice between starving in situ and moving, people move. In the latter part of the century tens of millions of Pakistani citizens may be facing this choice. Pakistan may find itself joining the growing list of failed states, as civil administration collapses and armed gangs seize what little food is left.
As the land burns, so the sea will go on rising. Even by the most optimistic calculation, 80% of Arctic sea ice by now will be gone, and the rest will soon follow. New York will flood; the catastrophe that struck eastern England in 1953 will become an unremarkable regular event; and the map of the Netherlands will be torn up by the North Sea. Everywhere, starving people will be on the move – from Central America into Mexico and the US, and from Africa into Europe, where resurgent fascist parties will win votes by promising to keep them out.
Chance of avoiding three degrees of global warming: poor if the rise reaches two degrees and triggers carbon-cycle feedbacks from soils and plants.
BETWEEN THREE AND FOUR DEGREES OF WARMING
The stream of refugees will now include those fleeing from coasts to safer interiors – millions at a time when storms hit. Where they persist, coastal cities will become fortified islands. The world economy, too, will be threadbare. As direct losses, social instability and insurance payouts cascade through the system, the funds to support displaced people will be increasingly scarce. Sea levels will be rampaging upwards – in this temperature range, both poles are certain to melt, causing an eventual rise of 50 metres. “I am not suggesting it would be instantaneous. In fact it would take centuries, and probably millennia, to melt all of the Antarctic’s ice. But it could yield sea-level rises of a metre or so every 20 years – far beyond our capacity to adapt.Oxford would sit on one of many coastlines in a UK reduced to an archipelago of tiny islands.
More immediately, China is on a collision course with the planet. By 2030, if its people are consuming at the same rate as Americans, they will eat two-thirds of the entire global harvest and burn 100m barrels of oil a day, or 125% of current world output. That prospect alone contains all the ingredients of catastrophe. But it’s worse than that: “By the latter third of the 21st century, if global temperatures are more than three degrees higher than now, China’s agricultural production will crash. It will face the task of feeding 1.5bn much richer people – 200m more than now – on two thirds of current supplies.” For people throughout much of the world, starvation will be a regular threat; but it will not be the only one.
The summer will get longer still, as soaring temperatures reduce forests to tinderwood and cities to boiling morgues. Temperatures in the Home Counties could reach 45C – the sort of climate experienced today in Marrakech. Droughts will put the south-east of England on the global list of water-stressed areas, with farmers competing against cities for dwindling supplies from rivers and reservoirs.
Air-conditioning will be mandatory for anyone wanting to stay cool. This in turn will put ever more stress on energy systems, which could pour more greenhouse gases into the air if coal and gas-fired power stations ramp up their output, hydroelectric sources dwindle and renewables fail to take up the slack. The abandonment of the Mediterranean will send even more people north to “overcrowded refuges in the Baltic, Scandinavia and the British Isles.
Britain will have problems of its own. As flood plains are more regularly inundated, a general retreat out of high risk areas is likely. Millions of people will lose their lifetime investments in houses that become uninsurable and therefore unsaleable? The Lancashire/Humber corridor is expected to be among the worst affected regions, as are the Thames Valley, eastern Devon and towns around the already flood-prone Severn estuary like Monmouth and Bristol. The entire English coast from the Isle of Wight to Middlesbrough is classified as at ‘very high’ or ‘extreme’ risk, as is the whole of Cardigan Bay in Wales.
One of the most dangerous of all feedbacks will now be kicking in – the runaway thaw of permafrost. Scientists believe at least 500 billion tonnes of carbon are waiting to be released from the Arctic ice, though none yet has put a figure on what it will add to global warming. One degree? Two? Three? The pointers are ominous.
As with Amazon collapse and the carbon-cycle feedback in the three-degree worldstabilising global temperatures at four degrees above current levels may not be possible. If we reach three degrees, therefore, that leads inexorably to four degrees, which leads inexorably to five?
Chance of avoiding four degrees of global warming: poor if the rise reaches three degrees and triggers a runaway thaw of permafrost.
BETWEEN FOUR AND FIVE DEGREES OF WARMING
We are looking now at an entirely different planet. Ice sheets have vanished from both poles; rainforests have burnt up and turned to desert; the dry and lifeless Alps resemble the High Atlas; rising seas are scouring deep into continental interiors. One temptation may be to shift populations from dry areas to the newly thawed regions of the far north, in Canada and Siberia. Even here, though, summers may be too hot for crops to be grown away from the coasts; and there is no guarantee that northern governments will admit southern refugees. Lynas recalls James Lovelock’s suspicion that Siberia and Canada would be invaded by China and the US, each hammering another nail into humanity’s coffin. Any armed conflict, particularly involving nuclear weapons, would of course further increase the planetary surface area uninhabitable for humans.
When temperatures were at a similar level 55m years ago, following a very sudden burst of global warming in the early Eocene, alligators and other subtropical species were living high in the Arctic. What had caused the climate to flip? Suspicion rests on methane hydrate – “an ice-like combination of methane and water that forms under the intense cold and pressure of the deep sea”, and which escapes with explosive force when tapped. Evidence of a submarine landslide off Florida, and of huge volcanic eruptions under the North Atlantic, raises the possibility of trapped methane – a greenhouse gas 20 times more potent than carbon dioxide – being released in a giant belch that pushed global temperatures through the roof.
Summer heatwaves scorched the vegetation out of continental Spain, leaving a desert terrain which was heavily eroded by winter rainstorms. Palm mangroves grew as far north as England and Belgium, and the Arctic Ocean was so warm that Mediterranean algae thrived. In short, it was a world much like the one we are heading into this century. Although the total amount of carbon in the atmosphere during the Paleocene-Eocene thermal maximum, or PETM, as scientists call it, was more than today’s, the rate of increase in the 21st century may be 30 times faster. It may well be the fastest increase the world has ever seen – faster even than the episodes that caused catastrophic mass extinctions.
Globalism in the five-degree world will break down into something more like parochialism. Customers will have nothing to buy because producers will have nothing to sell. With no possibility of international aid, migrants will have to force their way into the few remaining habitable enclaves and fight for survival.
Where no refuge is available, civil war and a collapse into racial or communal conflict seems the likely outcome. Isolated survivalism, however, may be as impracticable as dialling for room service. How many of us could really trap or kill enough game to feed a family? Even if large numbers of people did successfully manage to fan out into the countryside, wildlife populations would quickly dwindle under the pressure. Supporting a hunter-gatherer lifestyle takes 10 to 100 times the land per person that a settled agricultural community needs. A large-scale resort to survivalism would turn into a further disaster for biodiversity as hungry humans killed and ate anything that moved. Including, perhaps, each other. Invaders do not take kindly to residents denying them food. History suggests that if a stockpile is discovered, the householder and his family may be tortured and killed. Look for comparison to the experience of present-day Somalia, Sudan or Burundi, where conflicts over scarce land and food are at the root of lingering tribal wars and state collapse.
Chance of avoiding five degrees of global warming: negligible if the rise reaches four degrees and releases trapped methane from the sea bed.
BETWEEN FIVE AND SIX DEGREES OF WARMING
Although warming on this scale lies within the IPCC’s officially endorsed range of 21st-century possibilities, climate models have little to say about what Lynas, echoing Dante, describes as “the Sixth Circle of Hell”. To see the most recent climatic lookalike, we have to turn the geological clock back between 144m and 65m years, to the Cretaceous, which ended with the extinction of the dinosaurs. There was an even closer fit at the end of the Permian, 251m years ago, when global temperatures rose by – yes – six degrees, and 95% of species were wiped out.
That episode was the worst ever endured by life on Earth, the closest the planet has come to ending up a dead and desolate rock in space.” On land, the only winners were fungi that flourished on dying trees and shrubs. At sea there were only losers. Warm water is a killer. Less oxygen can dissolve, so conditions become stagnant and anoxic. Oxygen-breathing water-dwellers – all the higher forms of life from plankton to sharks – face suffocation. Warm water also expands, and sea levels rose by 20 metres.” The resulting “super-hurricanes” hitting the coasts would have triggered flash floods that no living thing could have survived.
There are aspects of the so-called “end-Permian extinction” that are unlikely to recur – most importantly, the vast volcanic eruption in Siberia that spread magma hundreds of metres thick over an area bigger than western Europe and shot billions of tonnes of CO2 into the atmosphere. That is small comfort, however, for beneath the oceans, another monster stirred – the same that would bring a devastating end to the Palaeocene nearly 200m years later, and that still lies in wait today. Methane hydrate.
What happens when warming water releases pent-up gas from the sea bed: First, a small disturbance drives a gas-saturated parcel of water upwards. As it rises, bubbles begin to appear, as dissolved gas fizzles out with reducing pressure – just as a bottle of lemonade overflows if the top is taken off too quickly. These bubbles make the parcel of water still more buoyant, accelerating its rise through the water. As it surges upwards, reaching explosive force, it drags surrounding water up with it. At the surface, water is shot hundreds of metres into the air as the released gas blasts into the atmosphere. Shockwaves propagate outwards in all directions, triggering more eruptions nearby.
The eruption is more than just another positive feedback in the quickening process of global warming. Unlike CO2, methane is flammable. Even in air-methane concentrations as low as 5%, the mixture could ignite from lightning or some other spark and send fireballs tearing across the sky. The effect would be much like that of the fuel-air explosives used by the US and Russian armies – so-called “vacuum bombs” that ignite fuel droplets above a target. According to the CIA, those near the ignition point are obliterated. Those at the fringes are likely to suffer many internal injuries, including burst eardrums, severe concussion, ruptured lungs and internal organs, and possibly blindness.” Such tactical weapons, however, are squibs when set against methane-air clouds from oceanic eruptions. Scientists calculate that they could “destroy terrestrial life almost entirely (251m years ago, only one large land animal, the pig-like lystrosaurus, survived). It has been estimated that a large eruption in future could release energy equivalent to 108 megatonnes of TNT – 100,000 times more than the world’s entire stockpile of nuclear weapons. Not even Lynas, for all his scientific propriety, can avoid the Hollywood ending. “It is not too difficult to imagine the ultimate nightmare, with oceanic methane eruptions near large population centres wiping out billions of people – perhaps in days. Imagine a ‘fuel-air explosive’ fireball racing towards a city – London, say, or Tokyo – the blast wave spreading out from the explosive centre with the speed and force of an atomic bomb. Buildings are flattened, people are incinerated where they stand, or left blind and deaf by the force of the explosion. Mix Hiroshima with post-Katrina New Orleans to get some idea of what such a catastrophe might look like: burnt survivors battling over food, wandering far and wide from empty cities.
Then would come hydrogen sulphide from the stagnant oceans. “It would be a silent killer: imagine the scene at Bhopal following the Union Carbide gas release in 1984, replayed first at coastal settlements, then continental interiors across the world. At the same time, as the ozone layer came under assault, we would feel the sun’s rays burning into our skin, and the first cell mutations would be triggering outbreaks of cancer among anyone who survived. Dante’s hell was a place of judgment, where humanity was for ever punished for its sins. With all the remaining forests burning, and the corpses of people, livestock and wildlife piling up in every continent, the six-degree world would be a harsh penalty indeed for the mundane crime of burning fossil energy.
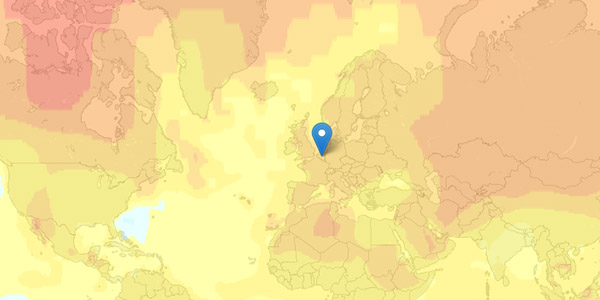
Warming World [newscientistapps.com], developed by Chris Amico and Peter Aldhous for the New Scientist, shows the distribution of ambient temperatures around the world, ranging from 1951 to now. The graphs and maps highlight the changes relative to the average temperatures measured between 1951 to 1980.
Users can click anywhere on the map and investigate an entire temperature record for that grid cell, retrieved via NASA's surface temperature analysis database GISTEMP, which is based on 6000 monitoring stations, ships and satellite measurements worldwide. Via the drop-down list at the top, users can also switch between different map overlays that summarize the average temperatures for different 20-year pictures. Accordingly, climate change become visible as the cool blue hues from previous decades are replaced with warm red and yellow hues around the start of the 20th Century.
Accordingly, this tool aims to communicate the reality and variability of recorded climate change, and compare that local picture with the trend for the global average temperature..
This blog is the survey website of fabric | ch - studio for architecture, interaction and research.
We curate and reblog articles, researches, writings, exhibitions and projects that we notice and find interesting during our everyday practice and readings.
Most articles concern the intertwined fields of architecture, territory, art, interaction design, thinking and science. From time to time, we also publish documentation about our own work and research, immersed among these related resources and inspirations.
This website is used by fabric | ch as archive, references and resources. It is shared with all those interested in the same topics as we are, in the hope that they will also find valuable references and content in it.
.jpg)