Friday, November 16. 2012
Personal comment:
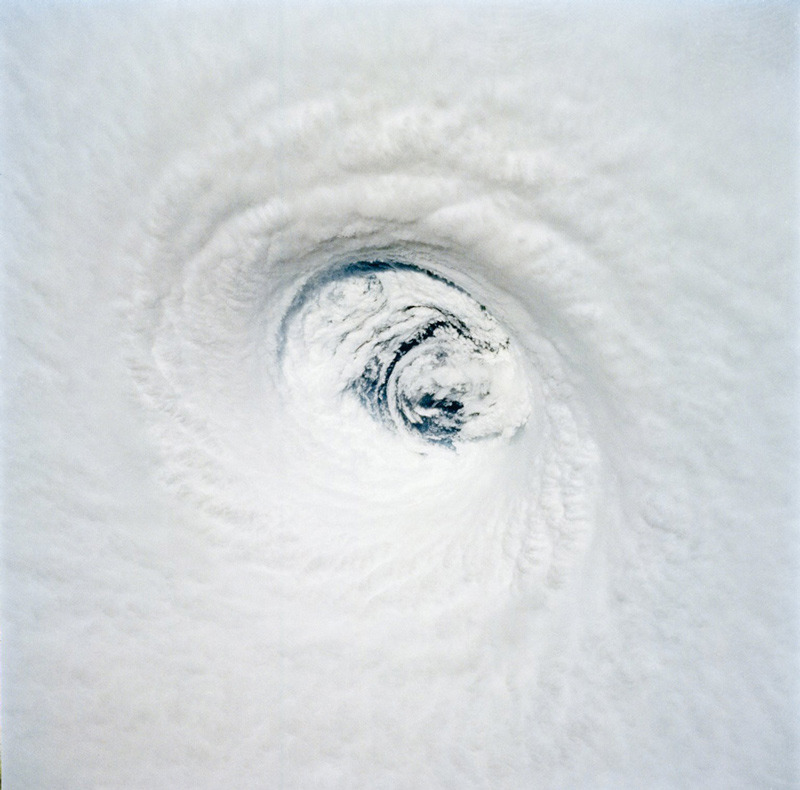
A set of (beautiful, if viewed from above...) pictures of hurricanes by Nasa. It also tells how far, at a large scale, a hurricane is some sort of continuous and dramatic climatic architecture. With different wind velocities, rain and pression (from inhabitable to uninhabitable) --could we harvest wind, hydro and piezoelectric energy from hurricanes btw?--, its relatively calm and sunny "patio" (the eye) and its tail.
What would it look like to produce an architecture to fully inhabit hurricanes, its different and variable climatic zones?
An interesting research would be to map the different geographic paths that hurricanes took (i.e. over the last 20 years) and sketch such an architecture and infrastructure (i.e. harvesting wind and hydroelectric energy, collecting water), to inhabit such a special climatic zone.
In a way, design environments for harder climatic events.
Monday, November 05. 2012
Via MIT Technology Review
-----
Using technology to cool the planet may be the only way to deal with the greenhouse gases already in the atmosphere, argues scientist David Keith.
By Kevin Bullis

David Keith spoke at MIT Technology Review’s EmTech conference this week.
Geoengineering—using technology to purposefully change the climate—is the only option for reducing the risk of climate change from greenhouse-gas emissions in the next few decades, says David Keith, a professor of public policy and applied physics at Harvard University. And he says that if it’s done in moderation, it could be much safer than some experts have argued. In fact, says Keith, effective methods of geoengineering are so cheap and easy that just about any country could do it—for better or worse.
Keith, speaking this week at MIT Technology Review’s annual EmTech conference, says it is already too late to avoid climate changes by reducing carbon emissions alone. The carbon dioxide that’s been released into the atmosphere by burning fossil fuels is already likely to cause significant harm, such as raising temperatures enough to hurt crop yields in many places. “If you want to, say, really stop the loss of Arctic sea ice or stop heat-stress crop losses over the next few decades, geoengineering is pretty much the only thing you can do,” he says (see “Why Climate Scientists Support Geoengineering Research”).
Keith’s preferred method of geoengineering is to shade the earth by injecting sulfate particles into the upper atmosphere, imitating a similar process that happens with large volcanic eruptions, which are known to temporarily cool the planet. The technique could be effective even if far less sulfate were injected than is currently emitted by fossil-fuel power plants. A million tons per year injected into the stratosphere would be enough—whereas 50 million tons are injected into the lower part of the atmosphere by coal plants, he says. (In the lower atmosphere, the sulfates are less effective at cooling because they stay airborne for shorter periods.)
One of the main objections to geoengineering is that the measures that might be taken to cool the planet won’t exactly offset the effects of carbon dioxide, so they could actually make things much worse—for example, by altering patterns of precipitation. Keith says recent climate models suggest that injecting sulfate particles into the upper reaches of the atmosphere might not affect precipitation nearly as much as others have warned.
“I propose that you start in about 2020, and you start very, very gradually increasing your amount of sulfate engineering so that you cut about in half the rate of warming,” he says. “Not eliminate it, but cut it about in half. Cutting it in half is a big benefit.”
One of the benefits could be increased crop production. Though some critics have worried that geoengineering would alter monsoon patterns that are key to agriculture in India, Keith says moderate geoengineering could actually boost crop productivity there by 20 percent, in part by reducing temperatures.
Keith and some of his colleagues recently hired engineers to estimate how much one approach to sulfate injection might work, and how much it might cost. It could be done at first with existing airplanes—certain business jets can fly high enough to inject the particles into the upper atmosphere. Eventually we would need new planes that can fly higher. All in all, once the procedure is scaled up it would cost about a billion dollars a year and require about 100 aircraft. That’s cheap enough for most countries to pull off on their own.
The fact that it’s easy isn’t necessarily a good thing, Keith says. There’s the potential that if one country does it, another might blame that country—rightly or wrongly—for ensuing bad weather (see “The Geoengineering Gambit”).
And there are also real concerns about the impact sulfates might have on the atmosphere (see Geoengineering May Be Necessary, Despite Its Perils). It’s known that sulfates can be involved in reactions that deplete the ozone layer. As the earth warms, water vapor levels are increasing, which could exacerbate the problem. Keith is proposing a test to discover quantitatively just what the effect of the injections could be. He would introduce small clouds of sulfate and water vapor into the stratosphere using balloons, and then carefully measure the reactions that take place.
And Keith acknowledges a concern many have had about geoengineering: that using it to offset problems from climate change will reduce the incentive to tackle the greenhouse-gas emissions at the root of the problem. Even if geoengineering is employed, reducing emissions will still be important. Sulfate injection does nothing to address the ocean acidification associated with increased levels of carbon dioxide in the atmosphere. And if emissions continue to grow, ever-increasing amounts of sulfate will be needed.
But Keith thinks the potential benefits might be worth the dangers. “We don’t know enough yet to start,” he says. “But the current balance of evidence is that doing this really would reduce risks. And for that reason, we’ve got to take it seriously. It really would be reckless not to look at something that could reduce risk like this could.”
Tuesday, July 24. 2012
By fabric | ch
-----
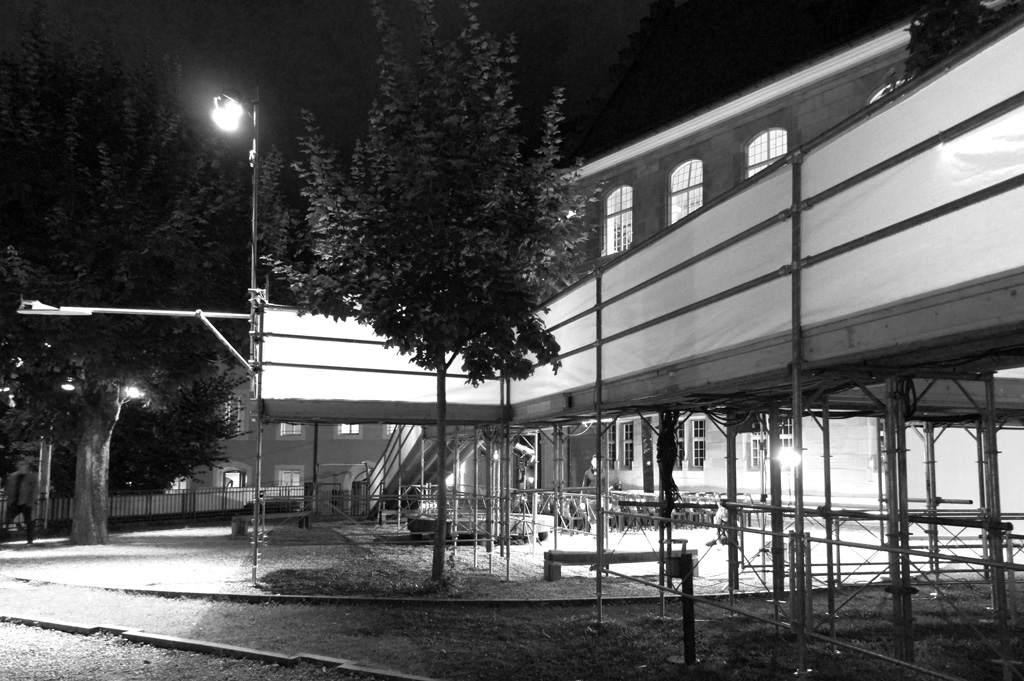
We remained relatively quiet on | rblg recently, as you may have noticed... This is mainly due to the fact that we were working hard on two new exhibitions for which we were setting up two different architectural installations.
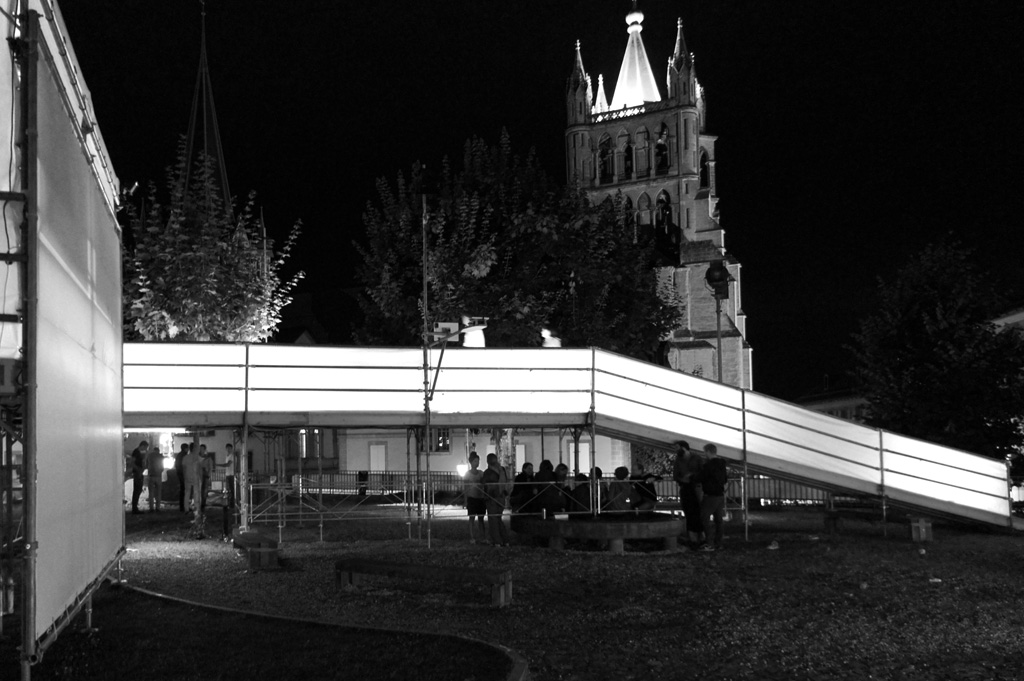
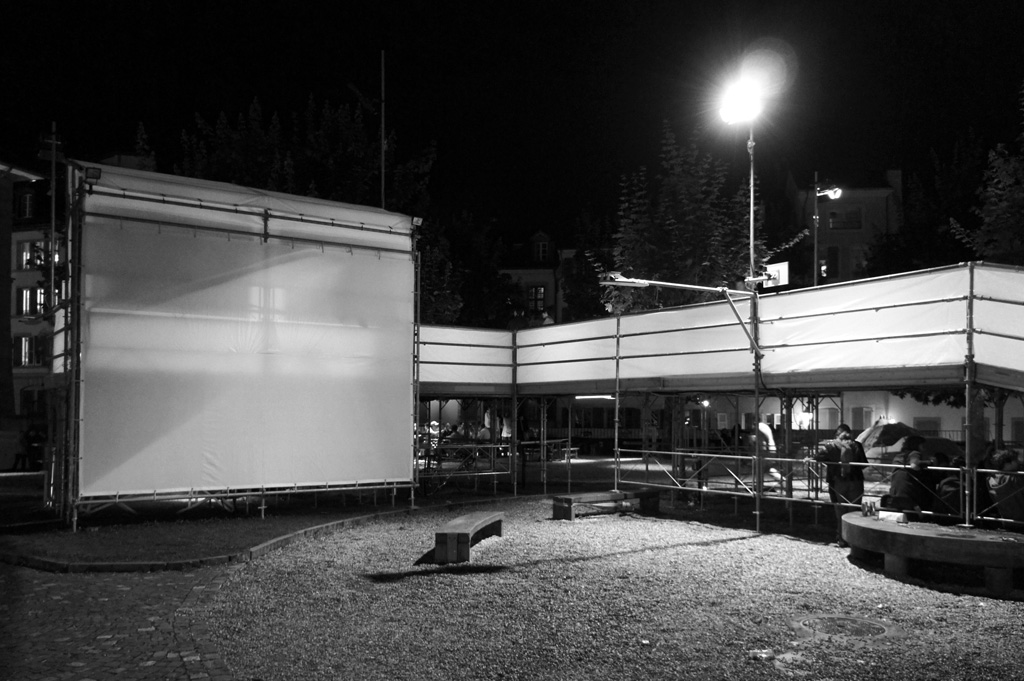
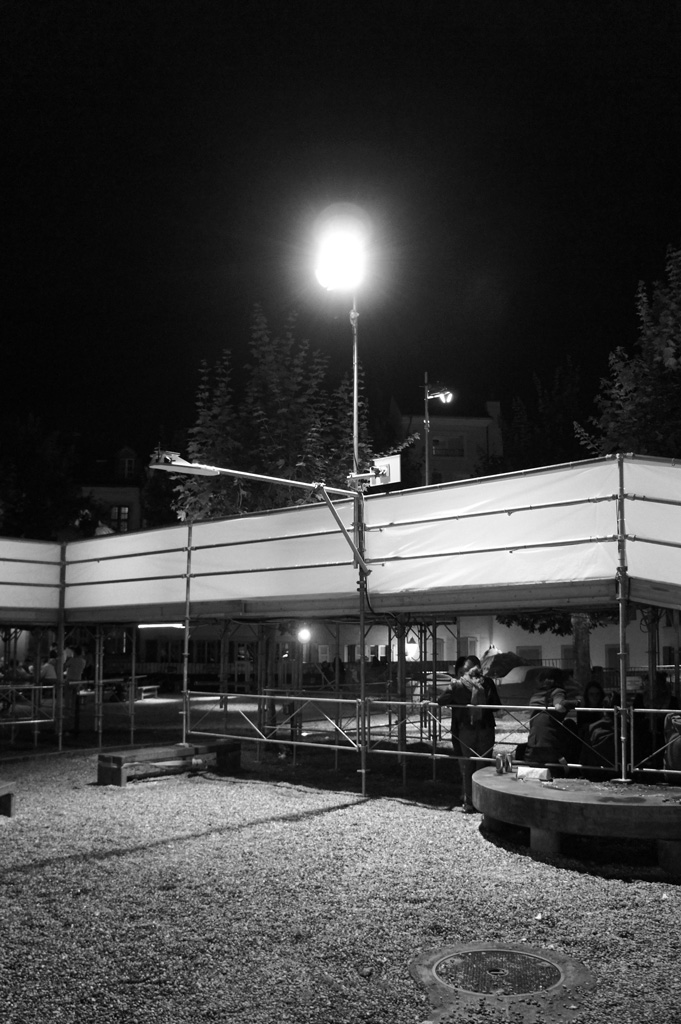
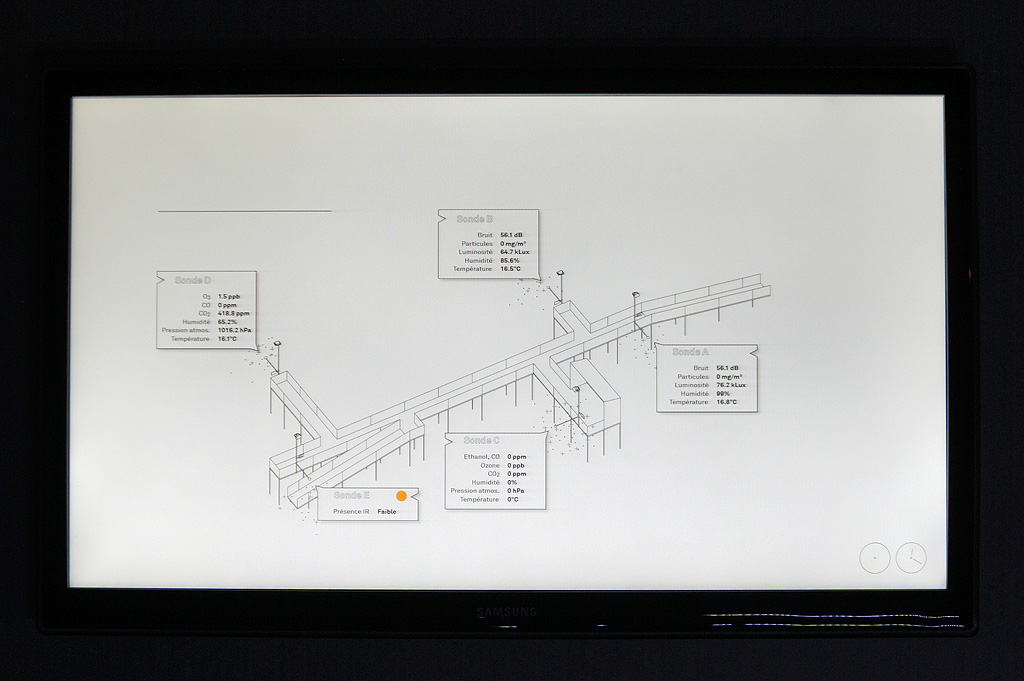
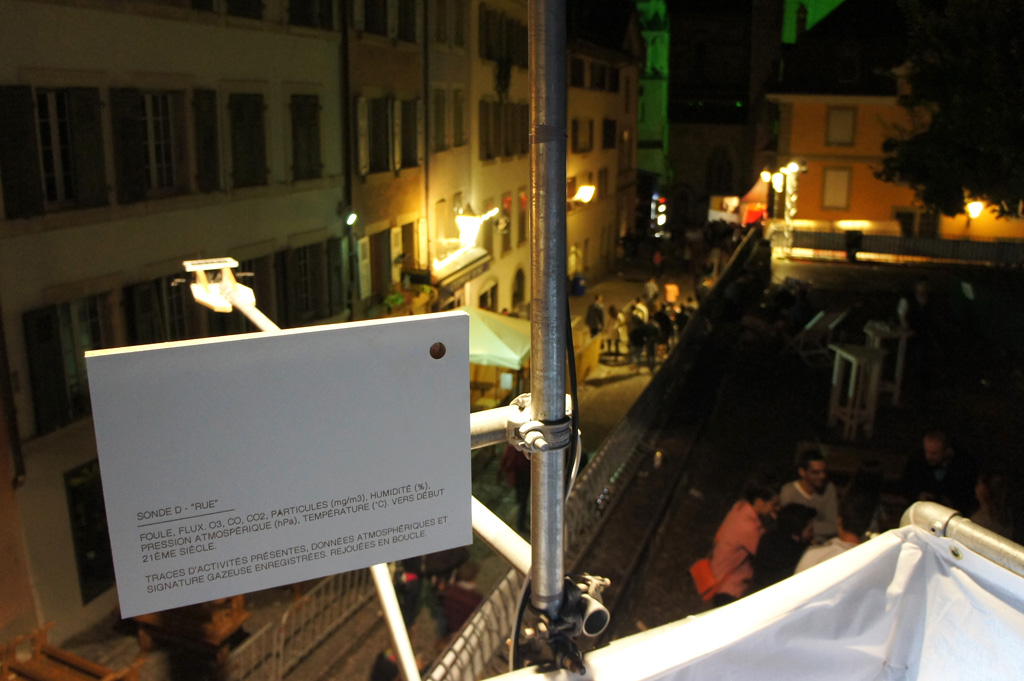
One of these installations was an old work, Perpetual (Tropical) Sunshine (re-exhibited in the context of the Transat Festival 2012, the work was presented in one of the oldest churches of the city) and the other was a new one, Hétérochronie, quite large for an installation (~40m long), that we were presenting in a very crowded festival (Festival de la Cité 2012), in the park of the old academy (16th century building, old school of theology). It was in this later case a real "crash test" for this type of work as the public was 1° not used at all to this type of architecture and 2° very "undisciplined", with lots of kids running everywhere... (that enjoyed it a lot by the way, but were so disappointed that the screens were not "touchable"...)
For once, both exhibitions happened in our home town and base camp: Lausanne and that was the first occasion for us to show our work to our... parents! Worse public, frightening! ;) As the Transat Festival is at first a music festival, as there was a fantastic organ in the church, we took the chance to set up a special sound performance with ensemBle baBel around John Cage's work during the exhibition of Perpetual (Tropical) Sunshine: Tropical - Cage.
I'll make a detailed post later this summer about the new work, Hétérochronie (Heterochrony), once we'll be back from the "Summer break". We'll also start to post again on a more regular basis on | rblg back in September. But before that, we'll go unplugged for a few weeks!
Till then, here are a few shots from both exhibitions:

 .jpg)
.jpg)
Perpetual (Tropical) Sunshine, Église Saint-François, Lausanne, June 2012.
.jpg) 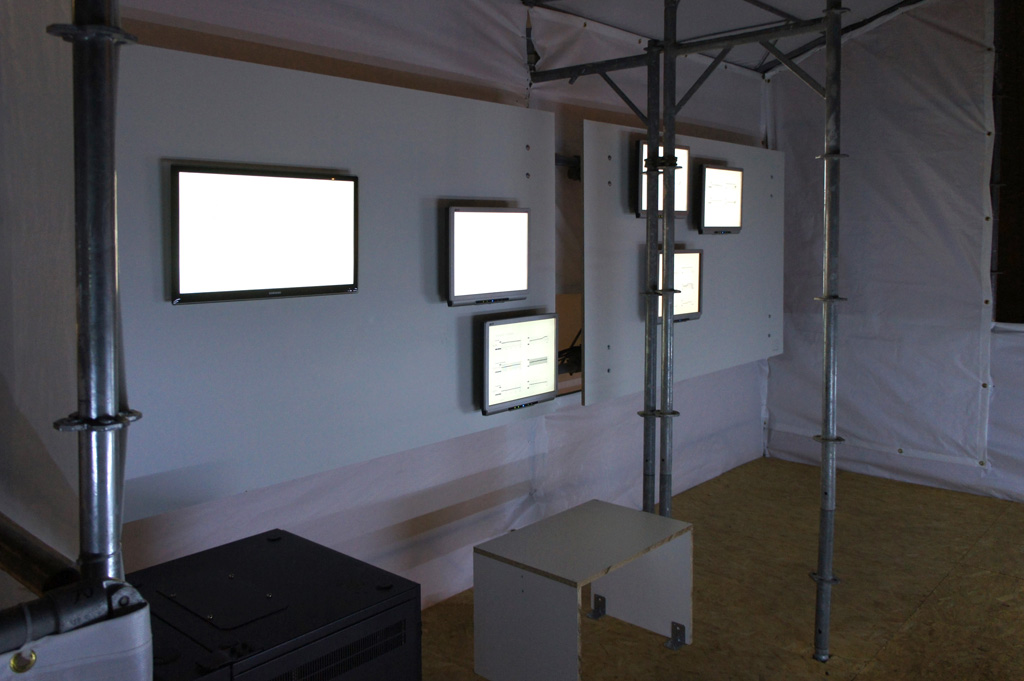
.jpg)

Heterochrony, Cour de l'Académie, Lausanne, July 2012.
Wednesday, May 09. 2012
Via BLDGBLOG
-----

[Image: Illustration by Jack Cook, Woods Hole Oceanographic Institution; courtesy of the USGS].
In Charles Fishman's compelling exploration of water on Earth, The Big Thirst, there is a shocking statement that, despite the apparent inexhaustibility of the oceans, "the total water on the surface of Earth (the oceans, the ice caps, the atmospheric water) makes up 0.025 percent of the mass of the planet—25/10,000ths of the stuff of Earth. If the Earth were the size of a Honda Odyssey minivan," he clarifies, "the amount of water on the planet would be in a single, half-liter bottle of Poland Spring in one of the van's thirteen cup holders."
This is rather remarkably communicated by an illustration from the USGS, reproduced above, showing "the size of a sphere that would contain all of Earth's water in comparison to the size of the Earth." That's not a lot of water.
Only vaguely related, meanwhile, there is an additional description in Fishman's book worth repeating here.
 [Image: The Orion nebula, photographed by Hubble]. [Image: The Orion nebula, photographed by Hubble].
In something called the Orion Molecular Cloud, truly vast amounts of water are being produced. How much? Incredibly, Fishman explains, "the cloud is making sixty Earth waters every twenty-four hours"—or, in simpler terms, "there is enough water being formed sufficient to fill all of Earth's oceans every twenty-four minutes." This is occurring, however, in an area "420 times the size of our solar system."
Anyway, Fishman's book is pretty fascinating, in particular his chapter, called "Dolphins in the Desert," on the water reuse and filtration infrastructure installed over the past 10-15 years in Las Vegas.
(Via @USGS).
Friday, March 30. 2012
Via information aesthetics
-----

Sometimes, particle animations work. Perpetual Ocean by NASA This visualization shows ocean surface currents around the world during the period from June 2005 through Decmeber 2007.
Interestingly, the visualization does not include any narration or annotations. Instead, the goal was to use ocean flow data to create a simple, visceral experience. The data was based on a high resolution model of the global ocean and sea-ice, that is able to capture ocean eddies and other narrow-current systems which transport heat and carbon in the oceans.
You can either hit your bandwidth allowance by downloading the 2GB versions at the NASA website, or watch the somewhat smaller, yet still HD version, below.
Via @aaronkoblin.
-----
And something similar with the wind:

http://hint.fm/wind/
Personal comment:
Beautiful climate's fluxes patterns. Change their scale (to the scale of a town? a house?) and just think about inhabiting them.
Wednesday, November 16. 2011
Via BLDGBLOG
-----
de noreply@blogger.com (Geoff Manaugh)
 [Image: "L.A. Ice" by Victor Hadjikyriacou, produced for Unit 11 at the Bartlett School of Architecture, part of last year's Landscape Futures Super-Workshop]. [Image: "L.A. Ice" by Victor Hadjikyriacou, produced for Unit 11 at the Bartlett School of Architecture, part of last year's Landscape Futures Super-Workshop].
The city of Ulan Bator, Mongolia, will attempt to keep itself cool over the summer by way of a kind of artificial glacier.
According to the Guardian, this "geoengineering trial" will try to "'store' freezing winter temperatures in a giant block of ice that will help to cool and water the city as it slowly melts during the summer." Project directors "hope the process will reduce energy demand from air conditioners and regulate drinking water and irrigation supplies." The cool air will presumably be pumped through the city via a continuous and monumental network of ducts.
So how will it work?
The project aims to artificially create "naleds"—ultra-thick slabs of ice that occur naturally in far northern climes when rivers or springs push through cracks in the surface to seep outwards during the day and then add an extra layer of ice during the night. Unlike regular ice formation on lakes—which only gets to a metre in thickness before it insulates the water below—naleds continue expanding for as long as there is enough water pressure to penetrate the surface. Many are more than seven metres thick, which means they melt much later than regular ice.
Fascinatingly, naleds have already been used as foundations for infrastructural projects elsewhere; in North Korea, for instance, the Guardian reports, the military has utilized naleds "to build river crossings for tanks during the winter and Russia has used them as drilling platforms."
The specific architectural technique of the ice bridge can be explored in this helpful PDF from the Alaska Division of Forestry. Quoting at great length, here are the skills you need to bridge remote rivers with artificially augmented ice packs, should such a scenario ever befall you or your loved ones. These are "guidelines for ice-bridge construction":
The ideal site has the following characteristics: deep, narrow, slow flow in a single straight channel with gradual approaches to the ice; no tributary streams, creeks or lakes immediately upstream; and it is located near an existing road network. The site should also be free of warm springs and sand bars and not subject to major snow drifting. Being downstream of riffles/rapids may be conducive to supercooling and frazil ice formation that might accelerate ic e formation and growth at the bridge site. (...) Once natural ice cover has progressed across the channel thick enough to bear the weight of personnel and light equipment, existing snow cover is removed to accelerate ice growth at the bottom of the ice sheet. Variation exists in whether snow is removed or just compacted. Snow removal is recommended on upstream and downstream sides of the road for a distance of 23-30 meters (75-100 feet) as well as on the road itself. Subsequent to ice growth in response to snow removal, surface flooding is recommended to build up ice thickness on the road surface. (...) Lateral barriers of snow, logs or boards are used to contain floodwater on the road surface. Water should be applied by layering, allowing full freezing of previous water applications before the next. Conflicting recommendations exist as to whether brush or logs should be incorporated into the ice. One study did document the increase in ice strength after incorporating geo-grid material during the ice buildup process. A regular regime of ice drilling and monitoring of ice thickness is recommended.
If you want something a little more hi-tech, on the other hand, the U.S. Army Cold Regions Test Center has slowly been amassing insight into the construction of ice roads and ice bridges.
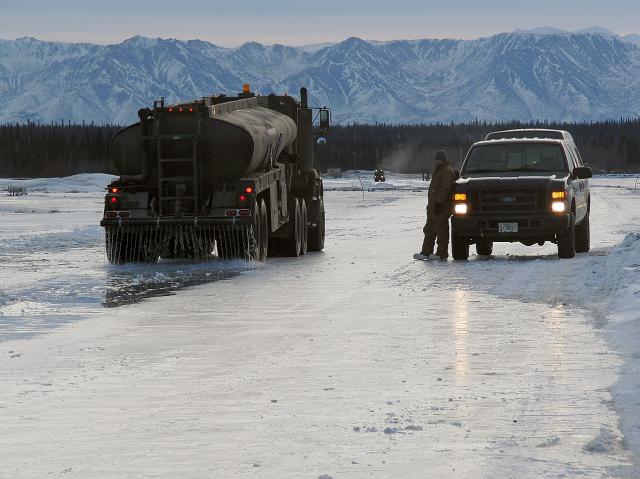 [Image: "A water truck passes over the ice road spreading a thin layer of water to thicken the ice so it can support heavy equipment transport"; photo courtesy of the U.S. Army]. [Image: "A water truck passes over the ice road spreading a thin layer of water to thicken the ice so it can support heavy equipment transport"; photo courtesy of the U.S. Army].
"Building an ice bridge/road takes a lot of time, hard work and favorable weather conditions," the Army reports. "The water must be frozen down to the riverbed, which requires breaking the ice down to the bottom and allowing it to freeze from the bottom up. The Engineers had to pump thousands of gallons of water onto the bridge/road to get the ice thick enough to support heavy equipment, while at the same time smoothing it out so vehicles could drive across it easily." The engineers involved in this particular story "established an ice bridge/road that was 28 inches thick in the beginning of January. With work scheduled to continue through the end of February, the engineers will add another 2.5 inches of ice every day."
And, as it happens, these experimental ice bridges grown by military personnel in the Arctic, like something out of Norse mythology, are a regular occurrence every winter.
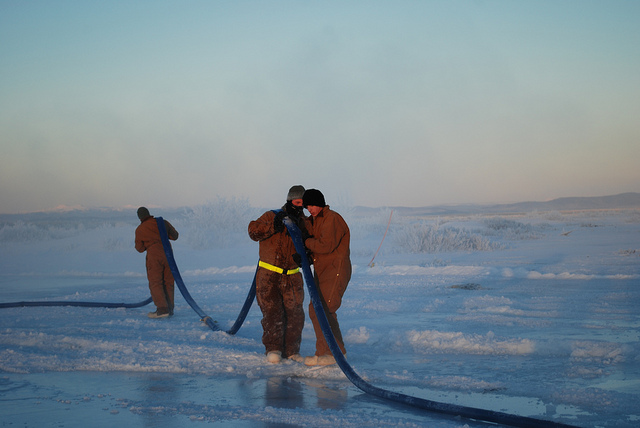 [Image: "Soldiers from the 6th Engineer Battalion, Fort Richardson, Alaska, clear water lines during construction of an ice bridge at the U.S. Army Cold Regions Test Center at Fort Greely, Alaska, Jan. 12, 2011." Photo by Sgt. Trish McMurphy, U.S. Army Alaska Public Affairs Office]. [Image: "Soldiers from the 6th Engineer Battalion, Fort Richardson, Alaska, clear water lines during construction of an ice bridge at the U.S. Army Cold Regions Test Center at Fort Greely, Alaska, Jan. 12, 2011." Photo by Sgt. Trish McMurphy, U.S. Army Alaska Public Affairs Office].
This year, for instance, the story repeated itself:
The engineers built field-expedient water tanks, berms of snow and crushed ice, to keep the water in designated areas for freezing. They move about 70,000 gallons of water per day using a gas-powered water pump and water lines. Once the bridge is capable of holding the weight, they will use 5,000 gallon water trucks to help speed up the process by delivering water faster than the pump.
The frames and techniques used for building with frozen water, then, are very similar to those used when dealing with concrete; in either case, it is the architecture of hardened liquids.
All told, the resulting ice bridge "will [be] slightly longer than a mile. It will be 24 inches thick and 75 feet wide. The bridge will grow and expand naturally with the weather changes, requiring some personnel to stay longer to maintain it." There are custodians of artificial ice forms and instant cities built from snow at the top of the world.
In any case, the massive ice block used to cool Ulan Bator—I almost forgot what this post is about—will presumably undergo the initial stages of sculpting and augmentation quite soon, as the true cold of winter sets in; we'll have to wait till next summer to see if it's successful.
(Earlier on BLDGBLOG: Artificial Glaciers 101).
Wednesday, July 27. 2011
-----
by Sarah Laskow
In the midst of this heat wave, it's hard to even remember what winter feels like. But for those inclined to plan ahead (way ahead) for freezing temperatures, Microsoft Research has a pitch for homeowners: Install a computer server where a heater would normally go.
It’s just an idea, but it’s based around the insight that, as the authors of the Microsoft Research paper write, “Physically, a computer server is a metal box that converts electricity into heat.” Servers’ exhaust air comes out at a scorching 104 to 122 degrees Fahrenheit. But that air is not hot enough to convert back into electricity. (The most common type of geothermal plant, for comparison, channels steam that’s more than 360 degrees.) Servers’ exhaust air is, however, “perfect for heating purposes,” the researchers argue. Channeling that excess heat could turn a regular old server into a “data furnace” that keeps homeowners warm in the winter, dries their clothes and heats their shower water.
As a widespread practice, replacing a run-of-the-mill furnace with a data furnace could save a lot of energy. Data centers use loads of electricity, and they’re only going to use more as more people stream and download more movies and music. But at least in the United States heating uses even more energy (6 percent of the national total, according to the Department of Energy) than servers do (3 percent). If servers doubled as heaters, we’d be getting the same services for half the energy cost.
Individual homeowners wouldn’t necessarily benefit from the switch. The Microsoft paper argues, in fact, that they wouldn’t even notice the difference. The companies running data centers, on the other hand, would benefit. According to the researchers’ back-of-the-envelope operations, the overhead cost per unit of running a host of data furnaces is about a fourth of the cost of running a conventional server farm. A big chunk of the savings comes from the convenience of housing the servers in buildings that people are already using: There’s no need for data centers to buy land and put up buildings with the sole purpose of sticking servers in them. They also save on cooling costs, because the heat they’d normally consider waste is going to good use.
The catch here is that few homeowners need heating year-round. The researchers assumed that heating would be useful whenever outside temperatures dropped below about 70 degrees. On warmer days, the heat would simply vent outside. On hot days, when temperatures top 95 degrees, the servers would have to shut down, since they wouldn’t have a cooling system built in. In places like San Francisco, the researchers calculated, the servers would be useful 96 percent of time and would virtually never have to shut down. In places like Dallas, on the other hand, they’d be useful only about half of the time.
But the Microsoft researchers allow that using servers as home heaters might be a stretch. Much more likely, they note, would be that larger buildings, like business complexes or apartment towers, would adopt the idea first.
Photo via the Department of Energy
Personal comment:
The new fireplace in the house is no more the tv set but the datacenter. Seems logical. Or, possibily, we should think about decentralized data centers, distributed in every house or appartement that would heat in winter and in summer... huh? Heat too? Maybe we could then even think of a seasonal computing: we could use our computers and the internet in Winter and early Spring, but not during Summer...
Tuesday, July 19. 2011
Via BLDGBLOG
-----
A slideshow over at National Geographic features this image by photographer Ian Wood, showing, in the magazine's own words, "what might be called extreme Inca landscaping."
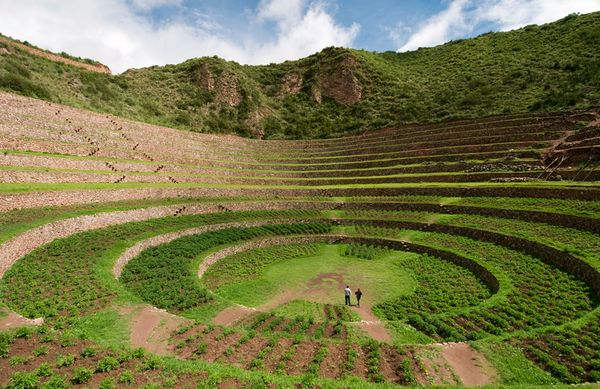 [Image: The weather bowl at Moray, Peru; photo by Ian Wood/Alamy, courtesy of National Geographic]. [Image: The weather bowl at Moray, Peru; photo by Ian Wood/Alamy, courtesy of National Geographic].
"Three enormous pits, each with beautifully curved sides that staircase down like the interiors of titanic flowerpots have been carved out of the earth to depths of up to 100 feet and more," the magazine adds. They are like Indian stepwells—only they concentrate thermal gradients—and this affects the local weather: "Air temperatures between the top and bottom layers can differ by more than 20 degrees, which has led some researchers to theorize that Moray was an Inca agricultural site where experiments on crops were conducted."
It's a site of experimental agriculture fueled by an act of microclimatic terrain deformation.
So does this mean that the weather at Moray should be subject not only to meteorological analysis, but to archaeological interpretation? The site you're excavating seamlessly continues into the sky above it, turning the weather itself into an historic artifact—a whole new spin on paleotempestology.
But is the weather created by an historic site also part of that historic site? If so, should ancient microclimates such as these be subject to material preservation? Put another way, if there were a Museum of Ancient Microclimates, how would you design it and what would the visitor experience be?
Imagine a whole constellation of these oversized weather pits, meanwhile, distributed throughout the Andes, all interacting with and augmenting one another, producing continent-scale storm systems—and imagine being hit by a summer downpour, or sitting calmly throughout the winter as blizzards rage just one valley over, knowing that the atmospheric events around you are really long-lasting cultural gifts of the people who lived there centuries before. Weather designed by your ancestors still rages around you today.
 [Image: From Sietch Nevada by Matsys; renderings by Nenad Katic]. [Image: From Sietch Nevada by Matsys; renderings by Nenad Katic].
Superficially, I'm reminded of the hexagonal "water storage banks" of Sietch Nevada, a speculative design by the San Francisco-based firm MATSYS. While the resemblance doesn't go much beyond form, this comparison lets us borrow MATSYS's idea of a water bank and, thus, reinterpret the Incan site at Moray as a kind of weather bank, storing temperatures and headwinds year round. It is a space to store climates in.
Extrapolating wildly from this, if the rise of the Himalayas radically altered the earth's climate by changing weather patterns for thousands of miles in all directions, then perhaps we can imagine a scenario in which a network of artificial pits in the Andes begins to affect the jet stream, plunging Australia into drought and pushing rain far north into Mexico—and that, in turns out, is those pits' very purpose, having been excavated by scientifically advanced, self-styled weather warriors more than 600 years ago for reasons still unclear today. Groups of elders would get together in the dark, sitting around their pits in tight circles as the winds picked up, burning incense, singing tales, hurling storms like artillery into the central Pacific.
(Thanks to Marilyn Terrell for the heads up!)
Wednesday, May 18. 2011
Via MIT Technology Review
-----
Infrared emissions above the epicentre increased dramatically in the days before the devastating earthquake in Japan, say scientists
Geologists have long puzzled over anecdotal reports of strange atmospheric phenomena in the days before big earthquakes. But good data to back up these stories has been hard to come by.
In recent years, however, various teams have set up atmospheric monitoring stations in earthquake zones and a number of satellites are capable of sending back data about the state of the upper atmosphere and the ionosphere during an earthquake.
Last year, we looked at some fascinating data from the DEMETER spacecraft showing a significant increase in ultra-low frequency radio signals before the magnitude 7 Haiti earthquake in January 2010
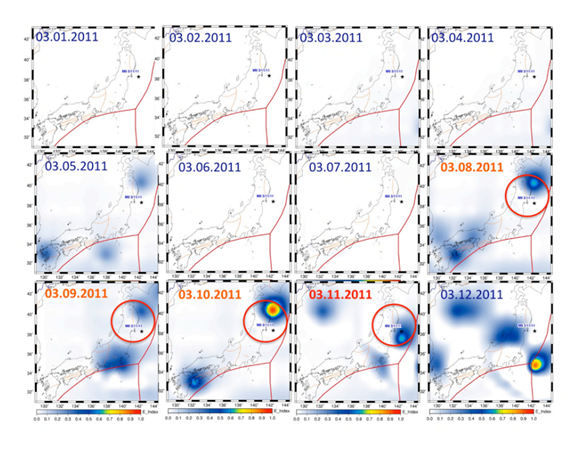
Today, Dimitar Ouzounov at the NASA Goddard Space Flight Centre in Maryland and a few buddies present the data from the Great Tohoku earthquake which devastated Japan on 11 March. Their results, although preliminary, are eye-opening.
They say that before the M9 earthquake, the total electron content of the ionosphere increased dramatically over the epicentre, reaching a maximum three days before the quake struck.
At the same time, satellite observations showed a big increase in infrared emissions from above the epicentre, which peaked in the hours before the quake. In other words, the atmosphere was heating up.
These kinds of observations are consistent with an idea called the Lithosphere-Atmosphere-Ionosphere Coupling mechanism. The thinking is that in the days before an earthquake, the great stresses in a fault as it is about to give cause the releases large amounts of radon.
The radioactivity from this gas ionises the air on a large scale and this has a number of knock on effects. Since water molecules are attracted to ions in the air, ionisation triggers the large scale condensation of water.
But the process of condensation also releases heat and it is this that causes infrared emissions. "Our first results show that on March 8th a rapid increase of emitted infrared radiation was observed from the satellite data," say Ouzounov and co.
These emissions go on to effect the ionosphere and its total electron content.
It certainly makes sense that the lithosphere, atmosphere and ionosphere are coupled in a way that can be measured when one of them is perturbed. The question is to what extent the new evidence backs up this idea.
The Japan earthquake is the largest to have struck the island in modern times and will certainly turn out to be among the best studied. If good evidence of this relationship doesn't emerge from this data, other opportunities will be few and far between.
Ref: arxiv.org/abs/1105.2841: Atmosphere-Ionosphere Response to the M9 Tohoku Earthquake Revealed by Joined Satellite and Ground Observations. Preliminary Results.
Friday, April 08. 2011
Via MIT Technology Review
-----
The social network breaks an unwritten rule by giving away plans to its new data center—an action it hopes will make the Web more efficient.
By Tom Simonite
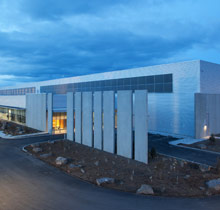 |
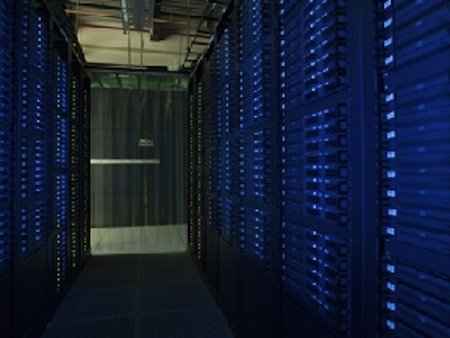
The new data center, in Prineville, Oregon, covers 147,000 square feet and is one of the most energy-efficient computing warehouses ever built.
Credit: Jason Madera |
Just weeks before switching on a massive, super-efficient data center in rural Oregon, Facebook is giving away the designs and specifications to the whole thing online. In doing so, the company is breaking a long-established unwritten rule for Web companies: don't share the secrets of your server-stuffed data warehouses.
Ironically, most of those secret servers rely heavily on open source or free software, for example the Linux operating system and the Apache webserver. Facebook's move—dubbed the Open Compute Project—aims to kick-start a similar trend with hardware.
"Mark [Zuckerberg] was able to start Facebook in his dorm room because PHP and Apache and other free and open-source software existed," says David Recordon, who helps coordinate Facebook's use of, and contribution to, open-source software. "We wanted to encourage that for hardware, and release enough information about our data center and servers that someone else could go and actually build them."
The attitude of other large technology firms couldn't be more different, says Ricardo Bianchini, who researches energy-efficient computing infrastructure at Rutgers University. "Typically, companies like Google or Microsoft won't tell you anything about their designs," he says. A more open approach could help the Web as a whole become more efficient, he says. "Opening up the building like this will help researchers a lot, and also other industry players," he says. "It's opening up new opportunities to share and collaborate."
The open hardware designs are for a new data center in Prineville, Oregon, that will be switched on later this month. The 147,000-square-foot building will increase Facebook's overall computing capacity by around half; the social network already processes some 100 million new photos every day, and its user base of over 500 million is growing fast.
The material being made available - on a new website - includes detailed specifications of the building's electrical and cooling systems, as well as the custom designs of the servers inside. Facebook is dubbing the approach "open" rather than open-source because its designs won't be subject to a true open-source legal license, which requires anyone modifying them to share any changes they make.
The plans reveal the fruits of Facebook's efforts to create one of the most energy-efficient data centers ever built. Unlike almost every other data center, Facebook's new building doesn't use chillers to cool the air flowing past the servers. Instead, air from the outside flows over foam pads moistened by water sprays to cool by evaporation. The building is carefully oriented so that prevailing winds direct outside air into the building in both winter and summer.
Facebook's engineers also created a novel electrical design that cuts the number of times that the electricity from the grid is run through a transformer to reduce its voltage en route to the servers inside. Most data centers use transformers to reduce the 480 volts from the nearest substation down to 208 volts, but Facebook's design skips that step. "We run 480 volts right up to the server," says Jay Park, Facebook's director of data-center engineering. "That eliminates the need for a transformer that wastes energy."
To make this possible, Park and colleagues created a new type of server power supply that takes 277 volts and which can be split off from the 408-volt supply without the need for a transformer. The 408 volts is delivered using a method known as "three phase power": three wires carry three alternating currents with carefully different timings. Splitting off one of those wires extracts a 277-volt supply.
Park and colleagues also came up with a new design for the backup batteries that keep servers running during power outages before backup generators kick in—a period of about 90 seconds. Instead of building one huge battery store in a dedicated room, many cabinet-sized battery packs are spread among the servers. This is more efficient because the batteries share electrical connections with the computers around them, eliminating the dedicated connections and transformers needed for one large store. Park calculates that his new electrical design wastes about 7 percent of the power fed into it, compared to around 23 percent for a more conventional design.
According to the standard measure of data-center efficiency—the power usage efficiency (PUE) score—Facebook's tweaks have created one of the most efficient data centers ever. A PUE is calculated by dividing a building's total power use by the energy used by its computers - a perfect data center would score 1. "Our tests show that Prineville has a PUE of 1.07," says Park. Google, which invests heavily in data-center efficiency, reported an average PUE of 1.13 across all its locations for the last quarter of 2010 (when winter temperatures make data centers most efficient), with the most efficient scoring 1.1.
Google and others will now be able to cherry pick elements from Facebook's designs, but that poses no threat to Facebook's real business, says Frank Frankovsky, the company's director of hardware design. "Facebook is successful because of the great social product, not [because] we can build low-cost infrastructure," he says. "There's no reason we shouldn't help others out with this."
Copyright Technology Review 2011.
Personal comment:
Will efficient and sustainable ways to organize architectural climate as well as to use energy become a by product of data centers? Might be.
|