Monday, February 23. 2009
The Washington Post TimeSpace: Locate the News in the World
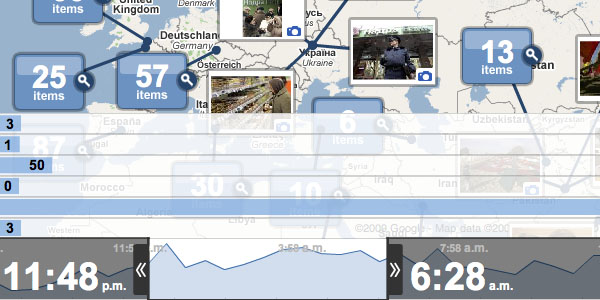
Is there finally a news outlet that steps into the information design terrain, which is seemingly dominated by The New York Times? TimeSpace [washingtonpost.com] is an interactive map that allows users to navigate articles, photos, video and commentary from around the globe. One can discover news hot-spots where coverage is clustered, use the slider timeline to illustrate peaks in coverage, or customize news searches to a particular day or specific hour.
Other news portals with maps include:
- SiloBreaker
- Life24
- What's Up?
- News Attention Map
- Vanishing Point
- NewsQuakes
- Yahoo! NewsGlobe
- TextMap
-----
Via Information Aesthetics
Related Links:
Personal comment:
Un Google Map mashup et "data design" par le Washington Post: mapping et concentration des news (du quotidien j'imagine) sur la carte mondiale. Petit détail: avec une variation temporelle.
(Air) Touring in Google Earth 5
WARNING: If you are prone to motion sickness - especially air sickness - you might not want to watch the following Google Earth tour!
This wasn't the intention, but several people who have seen the tour have been a little queasy afterwards. The file is yet another demonstration of the capabilities of the new Record Tour feature in Google Earth 5. One of the engineers at Google behind the development of the KML standard and the open source libkml is Michael Ashbridge. He took one of the first GPS tracks of a hang glider (or paraglider) which was converted to a KML file (back in 2005) and wrote an application to convert the track into a GE 5 tour which lets you follow the glider as it catches thermals to gain altitude near some mountains in Idaho. Before I say more, just go check out the tour  in Google Earth 5. Once it loads, double click "Linestring Tour".
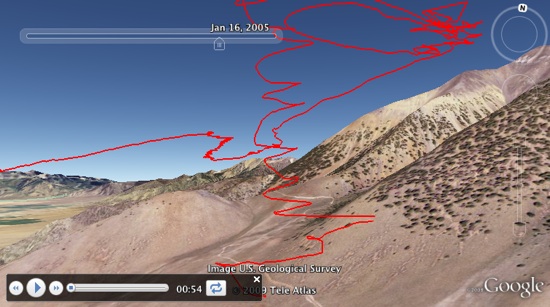
Michael's program produced the tour by following the GPS track and shows you the 3D view along the "string". It's a really cool experience (if you don't get sick!). GPS data is typically a bit inaccurate in altitude and only updated periodically (maybe once per second). But, the Tour function in GE 5 does a good job of interpolating between points to smooth the transitions. Even so, the ride gets a bit bumpy in places. The tour really gets interesting if you use the "Fast Forward" buttons on the Tour slider in the lower left.
While the tour is playing, if you grab areas with land with the mouse, you can drag your view to look in a different direction. After you let go with the mouse, the view will move back to following the track. This is a great feature which makes tours even more powerful because it takes a Tour from just being like a recorded video into a live 3D Google Earth recorded experience. But, there is a "bug" which doesn't let you grab the sky to change your view (which will hopefully be fixed when GE 5 goes out of beta).
-----
Personal comment:
Un petit exemple en passant pour mentionner et illustrer cette nouvelle "feature" dans GE 5: possiblité d'enregistrer et commenter des parcours (rem.: ce n'est pas le cas dans cet exemple) dans des fichiers kml (et donc transmettre cette information, visualisée dans GE)
Monday, February 16. 2009
Ski Chicago
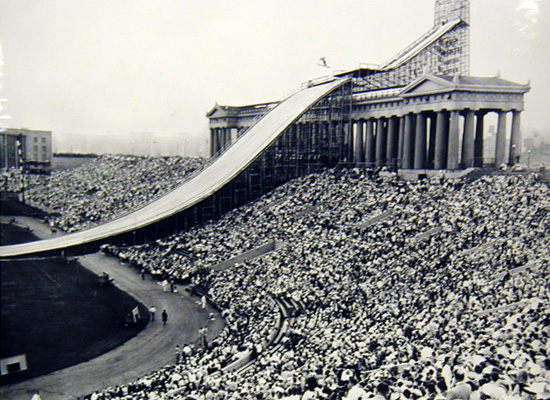
Berlin yet again; Chicago yet again. Earlier, we made a passing comparison between NURBN's Tempelhof See with The Hole. Now, to bring balance to the universe, we're twinning together Jakob Tigges' Tempelhof Mountain and a ski jumping ramp temporarily inserted into Chicago's Soldier Field in 1954, after all, is the ramp not an intimation of a mountain in the way that the other is a facsimile of a real one?
The latter is a mathematically perfect combination of topographical conditions. Contour lines, slopes and snow type, and maybe even favorable sun angles and prevailing wind direction for the athletes, and for the better enjoyment of the audience, an optimal viewing perspective, have all been co-opted to actualize a very specific event space.
The former is similarly a complicated exercise in mountain design. Tapping into a pathological desire for unspoiled Nature, a patch of Alpine wilderness is recreated hundreds of miles away in the center of Berlin. If actually built, it would mostly likely be ridiculously programmed in the same way so many parts of the Alps have been absurdly landscaped for winter enthusiasts.
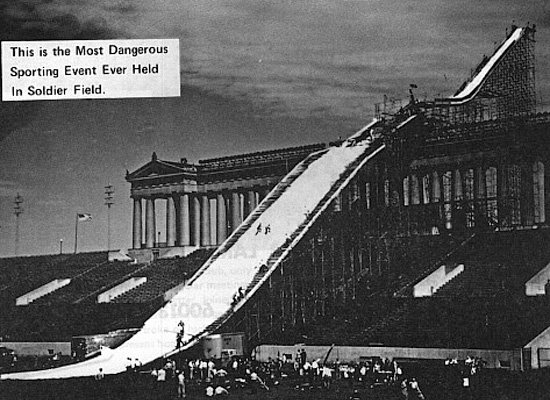
Before its renovation in 2003, the result of which garnered a rave review from The New York Times, even placed fourth in their list of the year's best new buildings, but got pummeled by local culture observers, Soldier Field was already being augmented, spectacularly at that if we are being honest.
Perhaps Zaha Hadid could be persuaded to design another ski jumping ramp, though this prosthesis would be hinged and can be flipped up whenever there's a Bears game. Those traveling along Lake Shore Drive or boating on Lake Michigan would see the wavy profile of a half Eiffel Tower. It's the technolicious abstraction of geology.
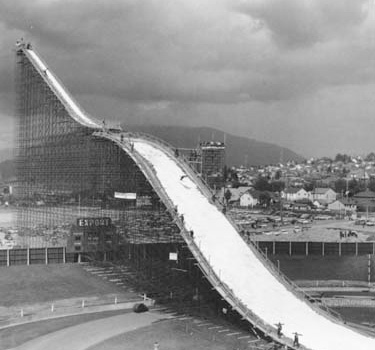
In any case, this sort of thing isn't as rare as we first thought. This ramp was erected in Empire Stadium, Vancouver, in 1958.
Even the stadiums of winterless Los Angeles were similarly augmented.
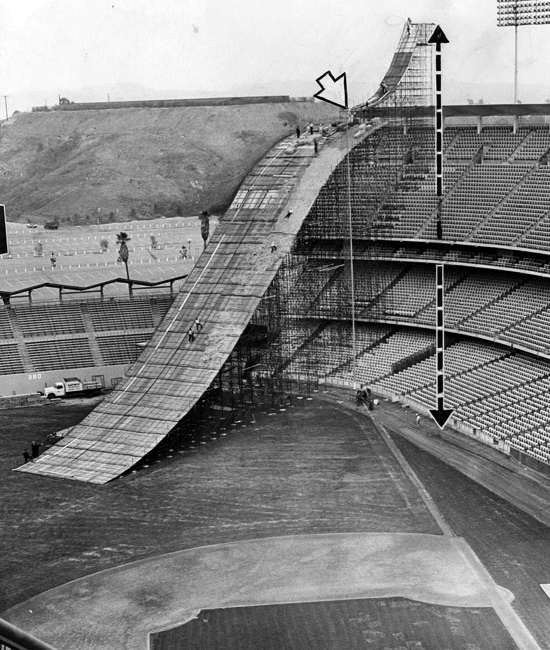
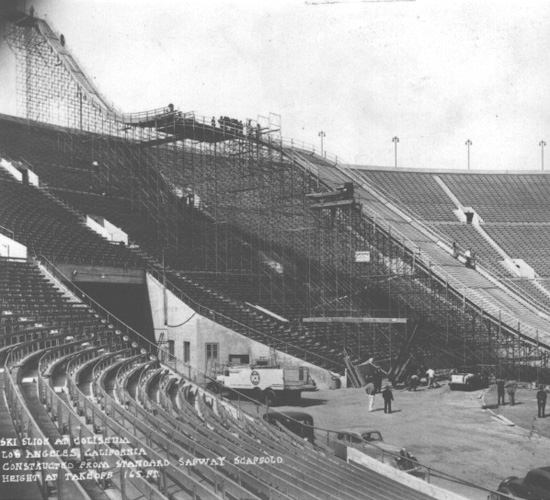
If you can't go to the mountains, bring the mountains to you.
Ice Climbing in the Abandoned Malls of Foreclosure America
-----
Via Pruned
Personal comment:
Interférences climatiques en 1954! ;)
Time in Google Earth 5
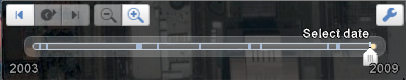
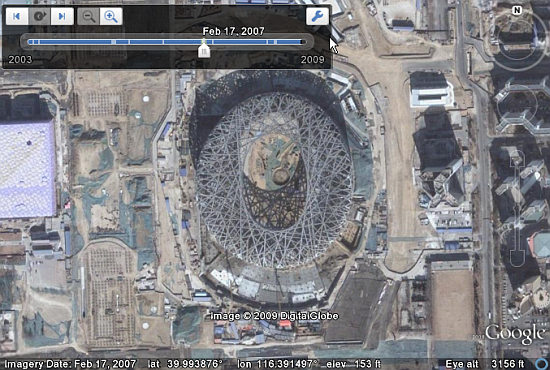
Google already had more satellite and aerial imagery available for free than anyone. Now, they've added a new feature to new Google Earth 5 that let's you turn back the clock and see other imagery they have for locations around the world. Click on the little "Clock" icon in the upper middle (or the "View->Historical Imagery" menu item). A time slider appears (see below) showing available imagery. If other imagery is available in your current view, you see little tic marks on the slider. Drag the slider (or click the left/right buttons) to see earlier or (or even newer) imagery.
For example, here's a shot of the famous "Bird's Nest" stadium from the 2008 Beijing Olympics as it appeared under construction on February 17, 2007:
And, here is a video showing this all in action:
This feature is amazing! The amount of data Google is storing must be immense! Several instances of imagery for millions of square kilometers! You may be able to see how your house changed over the years, or see aerial pictures of cities from decades ago. Expect to see lots of posts on this new feature.
Watermarks
Last night in Bristol, England, marked the start of Chris Bodle's Watermarks Project. For the next week, Bodle will be projecting onto the facades of buildings throughout Bristol estimated future high-tide marks should the entire Greenland ice cap melt.
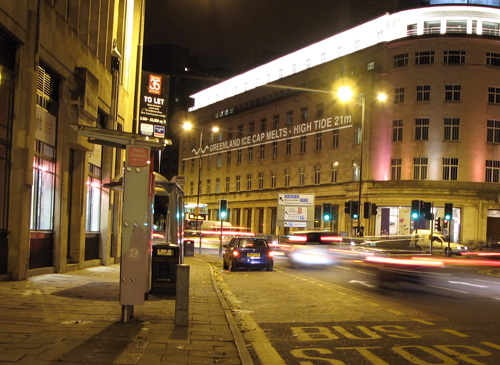 [Image: From Chris Bodle's Watermarks Project].
The idea is brilliant; I love the idea of mapping the future earth onto the earth of the present, of overlaying onto our present geography the virtual presence of a geography yet to come.
In many ways, I'd even say that this project can be divorced from its immediate context of climate change science and applied to any number of terrestrial processes, from the projected future and the hypothesized past. Whether mapping lost lakes of a different era or tracing the edges of disappeared lagoons that still haunt the streets of San Francisco – or reminding urbanites of the sport-fishing possibilities beneath Manhattan – we are alive within laminations we will never fully map or comprehend.
And these geographic superimpositions needn't all by hydrological: the constant erasures and revisions of the earth through plate tectonics represent an unlimited supply of counter-landscapes we might explore.
I'm reminded of John McPhee's fantastic book Assembling California – part of his equally great collection Annals of the Former World. There, McPhee describes how entire "Newfoundlands, Madagascars, New Zealands, Sumatras, [and] Japans" have all come together, rammed into place, one into the other over millions of years, to form what we now call California. Walking around Los Angeles, or through the coastal hills of Bug Sur, you're not walking on unified ground at all, then, but across "the metamorphosed remains of what had once been an island arc."
The ground here is all wandering, nomadic wreckage, only it's been temporarily "consolidated as California."
So could all those old islands be flagged, their mutated and compressed remains – sheer gravel, lone hillsides, folded slopes, and whole mountain ranges – marked out with surveyors' tape? The Archipelago Project. You cross and recross lost geographies made visible through an artist's intervention – or follow a new state hiking path that meanders around the edges of minor fault lines yet to open.
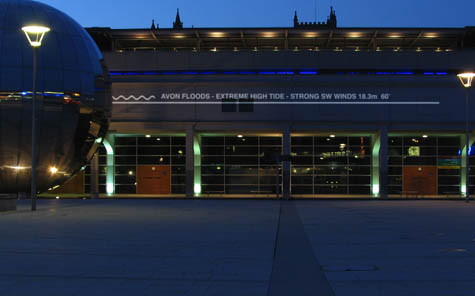 [Image: From Chris Bodle's Watermarks Project].
In any case, projecting the earth's future oceans onto a contemporary cityscape is an almost unbelievably stimulating idea.
These are the data points of a world yet to come, you might say, made visible here, now, on the fronts of a hundred buildings – a future or alternative version of the earth coming into focus all around us.
(Via the RSA's Arts & Ecology site, thanks to Nicky!)
-----
Via BLDBLOG
Personal comment:
Intéressant "mishmash" de temporalités (rapport au commentaire de Geoff Manaugh).
fabric | rblg
This blog is the survey website of fabric | ch - studio for architecture, interaction and research.
We curate and reblog articles, researches, writings, exhibitions and projects that we notice and find interesting during our everyday practice and readings.
Most articles concern the intertwined fields of architecture, territory, art, interaction design, thinking and science. From time to time, we also publish documentation about our own work and research, immersed among these related resources and inspirations.
This website is used by fabric | ch as archive, references and resources. It is shared with all those interested in the same topics as we are, in the hope that they will also find valuable references and content in it.
Quicksearch
Categories
Calendar
|
|
February '09 |
|
||||
| Mon | Tue | Wed | Thu | Fri | Sat | Sun |
| 1 | ||||||
| 2 | 3 | 4 | 5 | 6 | 7 | 8 |
| 9 | 10 | 11 | 12 | 13 | 14 | 15 |
| 16 | 17 | 18 | 19 | 20 | 21 | 22 |
| 23 | 24 | 25 | 26 | 27 | 28 | |
