Thursday, January 29. 2009
Review: The KML Handbook

Near the end of last year, the new book "The KML Handbook: Geographic Visualization for the Web" by Josie Wernecke was published. Josie is a Google documentation specialist who works for the Google Earth team. During the holidays, I received a copy of "The KML Handbook" for review. Click on the book image for more details on the book including prices at Amazon.
The book has a foreword by Michael T. Jones, Chief Technology Advocate for Google. Most long-time Google Earth folks know Michael has long been the chief advocate of Google Earth and was in fact a big part of the original team that created it. In the forward, Michael makes an excellent case that KML, as a way for annotating the world, can be used to change the world. And, in fact, through Google Earth, KML already has helped change the world.
Since this is a technical book about a standardized language similar to HTML, you might expect a lot of dry technical jargon with lots of coding examples. But, this book is nicely illustrated with many Google Earth color screenshots throughout the book. And, the illustrations aren't simple examples of basic KML functions. They illustrate many popular KML files by developers around the world which in most cases have appeared here at GEB. Examples like Valery's paleo-geographic animation, James' London Eye with shadows, and even Stefan Geens gets some KML photo examples in there.
For KML developers, or those who want to learn the language, this book is an easy read and well organized. It provides enough detail to get you started, and enough of an overview to expand your awareness of the many possible applications of KML. And, with many useful examples and colorful illustrations, the book keeps you fully engaged. It serves its purpose as a handbook for KML, but for in-depth KML details you'll still want to use the online KML reference documentaiton. Josie helped prepare the complete online KML documentation which provides all the information you need about KML. But, for those who prefer the familiarity of a good book in their hands, or want to learn the subject while on a long trip or night time reading, you can't do much better than "The KML Handbook". I highly recommend this book if you're looking for the best available written material on KML.
-----
Related Links:
Personal comment:
Un livre technique qui documente le language standardisé KML (Google Earth & Sketchup). Je soulignerais en particulier cette phrase tirée du post de Frank Talor: "(...) In the forward, Michael makes an excellent case that KML, as a way for annotating the world, can be used to change the world. And, in fact, through Google Earth, KML already has helped change the world. (...)".
Un langage informatique, qui plus est un language permettant de décrire des situations "virtuelles" et qui permettrait de changer le monde? Eh bien oui, en partie.
Wednesday, January 28. 2009
Mobile phones as pervasive traffic sensors
Tuesday, January 27. 2009
Climate Proofing the Netherlands (and Saving Architecture)

In the last years it seems to be an agreed upon fact that sea levels are certainly on the rise due to global climate change. Over the past 100 years, the seas have been climbing approximately 1.8mm per annum. Scientists have more recently been recording a rise of approximately 3.1mm per year (over the past 15 years) indicating that this rate is increasing. This is not only due to the melting of the polar ice caps (and all their precious fresh water), but more predominantly by the thermal expansion of the sea (heating water lowers the density of its molecules, thereby increasing its surface area). In the next century, sea levels are predicted to rise between 90 and 880mm. It is estimated that there are currently three billion coastal dwellers, which is expected to rise to six billion by 2025. As sea levels continue to increase, coastal and low-lying cities (or nations), such as the Netherlands, find themselves in a precarious position. A group of engineers and ocean experts on the Intergovernmental Panel on Climate Change predicts a forty-centimeter rise in the North Sea by 2025; between sixty-five centimeters and 1.3 meters by 2100; and up to 4 meters by 2200. These estimates have instigated the proactive Dutch to design pre-emptive measures of climatic defense.


The Netherlands is one of the few countries that have mastered building on the water. Largely built on reclaimed land, the Netherlands sits in a perilous location - a delta, created where the Rhine and Meuse Rivers flow into the North Sea. In 1953, a massive flood caused severe damage - killing nearly two thousand people and flooding over 150,000 hectares of land. In the aftermath of this devastation - just twenty days later - the Delta commission was born. The Delta commission was conceived to increase the safety of the Delta area of Holland without shutting down the seaways De Niuwe Waterweg and the Western Schelde (which connect to the prosperous ports of Rotterdam and Antwerp). Creating arguably the best defensive system of natural barriers, levees, dams, storm surge barricades, dunes, etc., the Delta Commission was successful at ‘climate proofing’ (their term for resisting flooding) the Netherlands for 1:10,000 year floods (for comparison, New Orleans is striving for 1:100 year levels by 2011). Although the risk seems low, the land below sea level in the Netherlands accounts for sixty-five percent of its GDP (approximately $450 billion per year), not to mention a population of 11 Million residents. As economics plays a large factor in ‘risk’ assessment, the following equation is often used to determine the viability of a ‘climate proofing’ project: Risk = (probability of failure) x (projected cost of damage)


The increased risks by future sea level changes (including the fact that climate change is also expected to promote higher precipitation in the Alps which will trickle through the rivers of Europe) have prompted the creation of the Delta Committee. Governmentally assigned, and comprise of a team of experts, the committee produced a report in 2008 that investigated how to climate-proof the Netherlands for the next century. The report proposed a 100-year mega project, which included extending the coastline and building new surge barriers while fortifying the levees. An estimated 400 square miles is to be added to the Netherlands (or seventeen ‘Manhattans’) over the course of the project. While the primary function of the infrastructural project is defensive in nature, it is hoped that the new construction, “interfaces with life and work, agriculture, ecology, recreation and leisure, landscape, infrastructure and energy”. Although, It is difficult to find concrete details on the design (the report is still only in Dutch), it is evident that it is a serious endeavor and one worth pursuing given the populace and economics with the affected zones.

The aggressive plan comes with a high price tag - approximately 1.5 billion Euros per year for the next 100 years. Although this may at first seem absurd, we must remember that Hurricane Katrina caused an upwards of $150 USD billion of damage, not to mention the loss of life, crippled economics and tourism. Further, the Dutch are motivated to start early to reduce overall costs and potentially avoid disaster. Currently, the project is in its initial stages, but the Dutch Government has already allocated 50 million euros to the research initiative “Knowledge for Climate Proofing the Netherlands.” This organization is researching climate-proofing techniques and new international technologies. Quoted by wired.com as “what may be the most ambitious act of territorial defense in history”, perhaps the next “great walls” will be to evade climate, instead of nations.
-----
Via InfraNet Lab
From Ego to Energy - Towers of Power Revisited

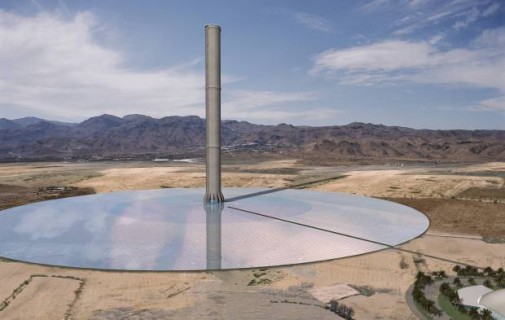
[EnviroMission\'s Proposal for a Solar Tower in Australia via www.t-mation.com]
As the race for the tallest tower progresses, research into solar power design has created (perhaps for the first time) a need for height. The solar updraft tower – a combination of a solar chimney, greenhouse and wind turbine – was first presented in 1903 by Spanish Colonel Isidoro Cabanyes in the magazine La Energia Electrica. Due to magnitudes of economics, solar towers garnered little attention until the 1980s. The present energy crisis has fueled a resurgence of solar tower design.
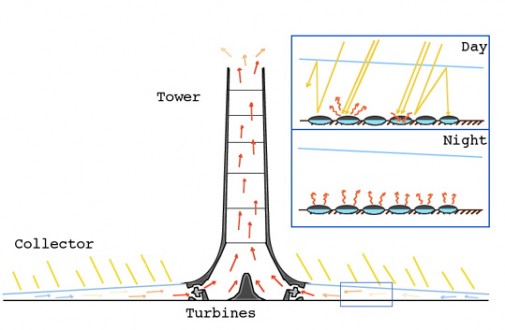
[Sectional Diagram revealing the operation of a Solar Tower via www.global-greenhouse-warming.com]
Solar towers are a unique invention that exploit the greenhouse effect to create energy. Powered by the sun, solar radiation heats a large glazed base that encircles a massive tower. The base essentially acts as a greenhouse to trap and heat the air. Naturally rising hot air finds its way to the tower, and is pulled through the solar chimney by convection currents, the vacuum effect continually drawing in more air. As this occurs, the updraft is able to spin a single or several wind turbines attached to the base of the tower. Like a hot air balloon, think of it as forcing a temperature differential to produce wind.
So where is the best spot to plant a solar tower? Flat, sun soaked conditions are ideal, within close proximity to the electrical grid. Further, areas with lower atmospheric winds and geologically stable land are preferred. It is possible to set up a solar tower in northern latitudes, but this requires the collection disk to slope towards to the south to capture maximum solar radiation (output is often lower as well, typically 85 percent of a strategically located solar tower). Lastly, because the collection greenhouses consume a vast amount of space, these towers are often only possible in areas with low land value (which, given the current economic crisis, is almost anywhere).
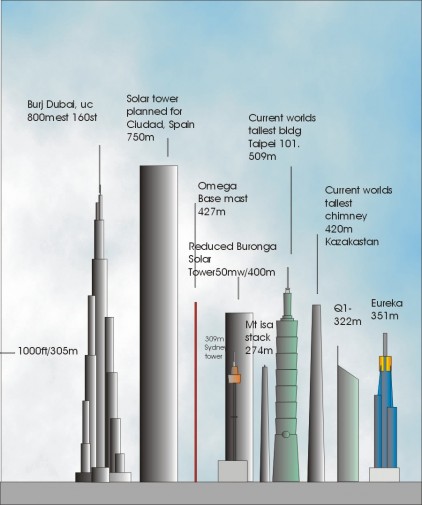
[Size Comparison of Solar Towers via skyscrapercity.com]
The amount of energy produced by solar towers is directly related to size – bigger is better. Taller chimneys create higher-pressure differentials, increasing the force on the wind turbine. Additionally, the size of the solar collection area and chimney affects the volume of air, and therefore the amount of energy produced. Current designs are being explored that couple a 1000m tall tower with a 20 sq.km greenhouse, yielding approximately 100MW of power. A similar tower with a 38 sq.km collection disk could produce a whopping 200MW, enough to power 200,000 houses.
The efficiency of solar towers is greatly reduced during the night. The turbines continue to rotate due to the super-heated land that heats the adjacent air, but the efficiency drops significantly. Researchers at RMIT and Ove Arup have incorporated salt-water ponds (also called ‘solar ponds’) because of their increased specific heat capacity, which traps heat in the layers of saltwater and releases it gradually during the dark hours.
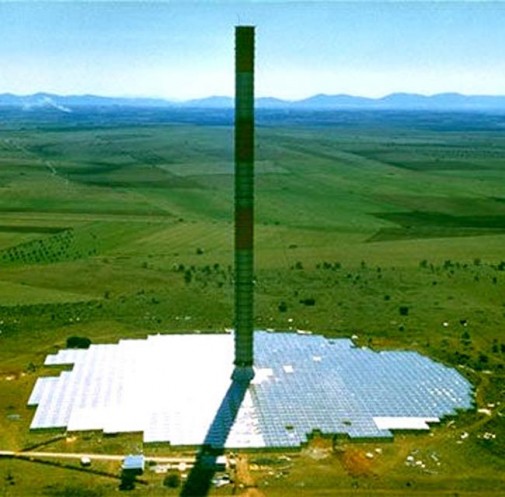
[Solar Tower Prototype in Manzanares, Spain via www.climate-changer.com]
Funded by the German government and designed by engineers Schlaich Bergermann and Partner, a small-scaled solar tower prototype was tested in Spain from 1982–1989. Sited 150 km south of Madrid in Manzanares, the tower stood 195m tall with a 10m diameter shaft. This coupled with a collection greenhouse of 46,000 sq.m, produced a maximum output of 50KW. Not intended for energy harvesting, the prototype allowed for the testing of various greenhouse materials.
[Rendering of Solar Tower proposed in China]
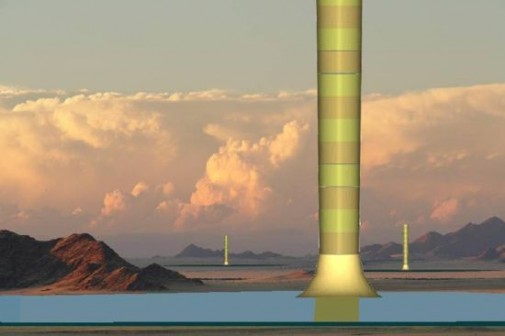
[EnviroMission\'s Solar Tower planned for Australia via www.unenergy.org]
Current proposals for a 750m tall tower in Spain, a 800m tall tower in China, and a 600m tall tower in Australia are underway. Renewable energy company, EnviroMission is set to build the tower in Australia, a country that is currently powered by cheap coal. The tower is engulfed by a 65m diameter collection area (approximately 6 times larger than central park) and expected to provide enough energy to power between 100,000 and 200,000 homes. This would save more than 900,000 tons of greenhouse carbon dioxide emissions from entering the Australian atmosphere
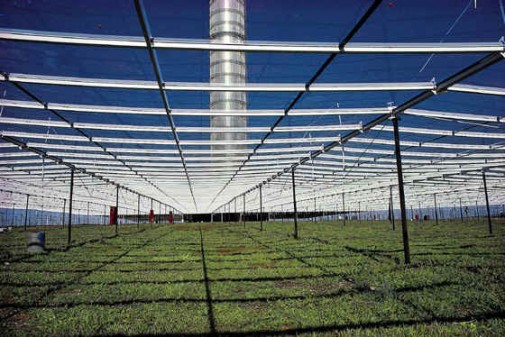
[Productive Landscape within the Greenhouse via todaysfacilitymanager.com]
Interestingly, the prototype solar tower built in the desert, fostered conditions conducive to the growth of plant life. This was due to condensation created at night that enlivened the soil with moisture, essentially transforming the desert into arable land. Not only can these collection areas add water to otherwise unproductive land, the towers could be linked with other programmes. Think of large office or residential towers that have a solar chimney at their core. Venting the exhaust heat from these additional programmes into the solar chimney would increase the updraft current, producing more energy. Plus, every resident could have clean energy and a garden plot in the middle of the desert.
-----
Via InfraNet Lab
Related Links:
Personal comment:
A propos de la taille vs production d'énergie des Tours solaires. Où l'on découvre qu'il faudrait une tour de 195m de haut et 10m de diamètre, couplée à un champ de 46'000 mètres carrés de "collection greenhouses" (! --selon un essai datant des années 80--) pour produire l'énergie maximum utilisée par Perpetual (Tropical) SUNSHINE ... Well, on y est pas encore!
Tuesday, January 20. 2009
Rising like alien plants on the terraformed lakebed
One of the interesting things — and there are definitely many — that you will read about in Kazys Varnelis' paean to the “networked ecologies” of Los Angeles, The Infrastructural City, is the dust control system at Owens Lake.
After decades of monumental water projects that diverted the lake's “life-giving liquid” to quench a distant city's thirsty populace, to ensure the perfect shade of green for their lawns, and to turn their swimming pools into aqueous micro-paradises, the desiccated remains of the lake now threatens the health of the people in the surrounding region.
Writes Barry Lehrman, author of the first chapter:
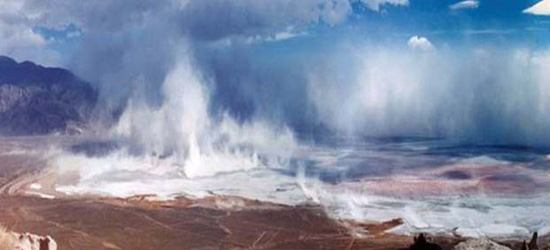
Wind gusts above twenty miles an hour lifted over fifty tons per second of “Keeler Fog” off the lakebed. Often reaching over two miles high, these dust storms sent 130 times the United States Environmental Protection Agency's limit for particulate matter into the atmosphere, blowing the dust over 250 miles from the lake. Such storms occurred two dozens or more times each year, generally in the spring and fall. Composed of microscopic particles smaller than ten microns (PM10), the dust contains significant levels of toxic metals like selenium, arsenic, and lead along with efflorescent salts. The largest single source of PM10 pollution in the country, these dust storms were a clear threat to the 40,000 people in the immediate region.
The dusts are such a health hazard that they have been linked to “significant health problems in the region, including higher rates of cancer, lung disease, and eye problems.”
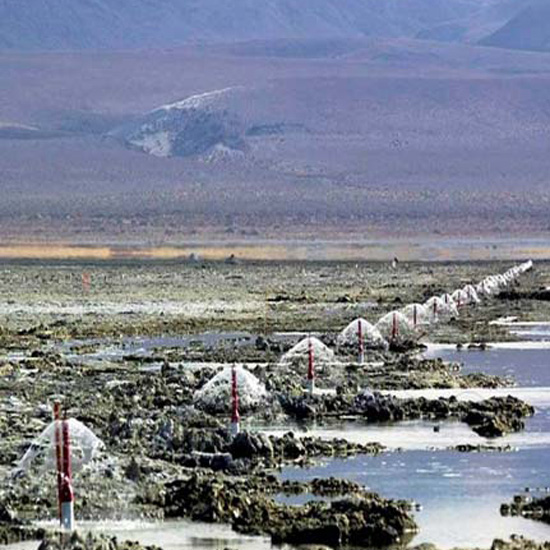
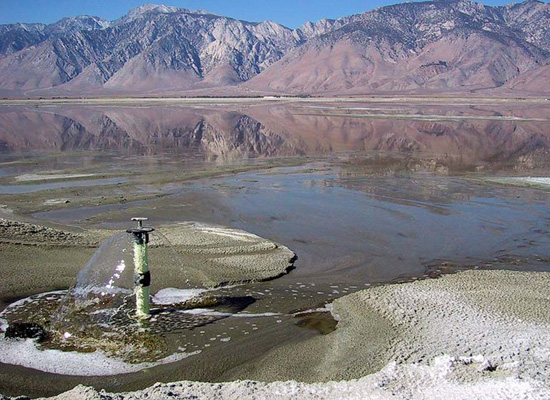
To combat these carcinogenic storms, Los Angeles grafted onto the desiccated corpse of the lake a hydro-network as monumental as the existing network responsible for the situation it is tasked to offset: “over 300 miles of pipe (some as large as five feet in diameter), more than 5,000 irrigation bubblers, and hundreds of miles of fiber optic control cables and valves.”
[T]he dust control projects on Owens Lake is roughly equivalent to that of a waterworks for a city of over 220,000 people. Construction of the first five phases, treating the worst thirty square miles of dust-emitting soils on the playa, has cost the City of Los Angeles $425 million dollars to build. But that sum doesn't factor in the lost revenue from the water being appropriated for the project (around $15 million/year) or the operations and maintenance budget, some $10 million per year.
“[R]ising like alien plants on the terraformed lakebed,” the bubblers flood the playa with shallow water, creating the merest suggestion of a lake, a perverse reminder of Lake Owens' former self.
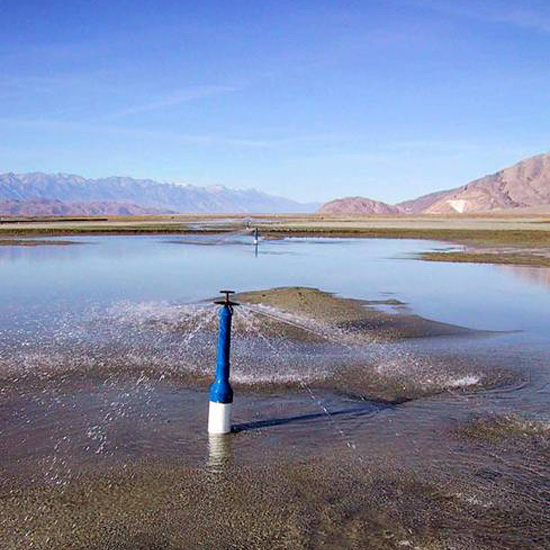
However superficial such observations may be, we couldn't help but see similarities between these bubblers and fountains found in historic gardens.
Firstly, much like the fountains at Versailles, behind these water spouts is a staggering hydrological infrastructure. Among other things, Versailles had the Machine de Marley, considered the greatest engineering marvel of its time; Owens Lake is part of what is probably the greatest water engineering project of the 20th century.
Secondly, since time immemorial, fountains like those at the Alhambra have been creating micro-climates, cooling gardens, palaces and sartorially bedecked aristocrats. The array of bubblers, you could say, is also a type of weather modification system: an anti-dust storm. Moreover, fountains like those at Columbus Circle in Manhattan can provide a sonic barrier, making one unaware of the tumult outside; with some conjecture, probably forced, you could say that the bubblers don't do much to make Los Angelenos more aware of the negative environmental effects their method of living are contributing outside the city.
Thirdly, if one can only speculate that fountains have ameliorative effects on one's mental state, you probably don't need to speculate the positive health effects of the bubblers.
Fourthly, fountains like those in Rome are objects for aesthetic consumption; the ebullient and rather photogenic sprinklers, thanks to CLUI, have been appropriated as part of a staged aesthetic experience.
Lastly, and most significantly, they are the products of a complex network of intermingling social, technological, political, economic and geographical conditions, the manifestations of competing ideologies and agendas. They're not mere water features, in other words.
In any case, we recommend the book.
On fountains
-----
Via Pruned
Related Links:
Personal comment:
A propos des "écologies" ou systèmes écologiques en réseau (réseau d'eau, d'énergie, d'information, etc.). Ici un cas particulier, un "tarraforming" ou mise en forme de la Terre (architecture de la Terre) à un niveau écologique et qui consiste en la remise en place artificielle d'un lac naturel afin de contrôler un système climatique...
fabric | rblg
This blog is the survey website of fabric | ch - studio for architecture, interaction and research.
We curate and reblog articles, researches, writings, exhibitions and projects that we notice and find interesting during our everyday practice and readings.
Most articles concern the intertwined fields of architecture, territory, art, interaction design, thinking and science. From time to time, we also publish documentation about our own work and research, immersed among these related resources and inspirations.
This website is used by fabric | ch as archive, references and resources. It is shared with all those interested in the same topics as we are, in the hope that they will also find valuable references and content in it.
