Wednesday, July 24. 2013
Who's Your Data? Urban Design in the New Soft City
Via Archinect
-----

Smart city infrastructure can augment the ability of managers, planners, designers and engineers to define and implement a fundamentally better next generation of buildings, cities, regions — right? Maybe. For that to be a serious proposition, it’s going to have to be normal for planners and designers not only to collaborate productively with engineers, but to do so with the full and competent participation of the only people they mistrust more than each other ... customers.
"A city is not a BMW," writes Carl Skelton. "You can't drive it without knowing how it works." In a weighty think-piece on Places, he argues that the public needs new tools of citizenship to thrive in a "new soft world" increasingly shaped by smart meters, surveillance cameras, urban informatics and big data. "To be a citizen of a digital city requires understanding what the databases do and don’t contain, and what they could contain, and how the software used to process that data and drive design decisions does, doesn’t, and might yet perform."
Troubleshooting The Smart City
Tuesday, July 23. 2013
New system uses low-power Wi-Fi signal to track moving humans even behind walls
Via MIT News
-----

Illustration: Christine Daniloff/MIT
The comic-book hero Superman uses his X-ray vision to spot bad guys lurking behind walls and other objects. Now we could all have X-ray vision, thanks to researchers at MIT’s Computer Science and Artificial Intelligence Laboratory.
Researchers have long attempted to build a device capable of seeing people through walls. However, previous efforts to develop such a system have involved the use of expensive and bulky radar technology that uses a part of the electromagnetic spectrum only available to the military.
Now a system being developed by Dina Katabi, a professor in MIT’s Department of Electrical Engineering and Computer Science, and her graduate student Fadel Adib, could give all of us the ability to spot people in different rooms using low-cost Wi-Fi technology. “We wanted to create a device that is low-power, portable and simple enough for anyone to use, to give people the ability to see through walls and closed doors,” Katabi says.
The system, called “Wi-Vi,” is based on a concept similar to radar and sonar imaging. But in contrast to radar and sonar, it transmits a low-power Wi-Fi signal and uses its reflections to track moving humans. It can do so even if the humans are in closed rooms or hiding behind a wall.
As a Wi-Fi signal is transmitted at a wall, a portion of the signal penetrates through it, reflecting off any humans on the other side. However, only a tiny fraction of the signal makes it through to the other room, with the rest being reflected by the wall, or by other objects. “So we had to come up with a technology that could cancel out all these other reflections, and keep only those from the moving human body,” Katabi says.
Motion detector
To do this, the system uses two transmit antennas and a single receiver. The two antennas transmit almost identical signals, except that the signal from the second antenna is the inverse of the first. As a result, the two signals interfere with each other in such a way as to cancel each other out. Since any static objects that the signals hit — including the wall — create identical reflections, they too are cancelled out by this nulling effect.
In this way, only those reflections that change between the two signals, such as those from a moving object, arrive back at the receiver, Adib says. “So, if the person moves behind the wall, all reflections from static objects are cancelled out, and the only thing registered by the device is the moving human.”
Once the system has cancelled out all of the reflections from static objects, it can then concentrate on tracking the person as he or she moves around the room. Most previous attempts to track moving targets through walls have done so using an array of spaced antennas, which each capture the signal reflected off a person moving through the environment. But this would be too expensive and bulky for use in a handheld device.
So instead Wi-Vi uses just one receiver. As the person moves through the room, his or her distance from the receiver changes, meaning the time it takes for the reflected signal to make its way back to the receiver changes too. The system then uses this information to calculate where the person is at any one time.
Possible uses in disaster recovery, personal safety, gaming
Wi-Vi, being presented at the Sigcomm conference in Hong Kong in August, could be used to help search-and-rescue teams to find survivors trapped in rubble after an earthquake, say, or to allow police officers to identify the number and movement of criminals within a building to avoid walking into an ambush.
It could also be used as a personal safety device, Katabi says: “If you are walking at night and you have the feeling that someone is following you, then you could use it to check if there is someone behind the fence or behind a corner.”
The device can also detect gestures or movements by a person standing behind a wall, such as a wave of the arm, Katabi says. This would allow it to be used as a gesture-based interface for controlling lighting or appliances within the home, such as turning off the lights in another room with a wave of the arm.
Venkat Padmanabhan, a principal researcher at Microsoft Research, says the possibility of using Wi-Vi as a gesture-based interface that does not require a line of sight between the user and the device itself is perhaps its most interesting application of all. “Such an interface could alter the face of gaming,” he says.
Unlike today’s interactive gaming devices, where users must stay in front of the console and its camera at all times, users could still interact with the system while in another room, for example. This could open up the possibility of more complex and interesting games, Katabi says.
Personal comment:
This will probably restart the interests of private companies to provide "public" or private wifi "for free" or at least to equip large urban areas without charging for the work and the hardware (as you won't need to be connected to the wifi to be tracked, see?). As long as they'll be allowed to collect data, mine for crowd patterns and behaviors... (a new case for persons in charge of data protection).
Wednesday, June 19. 2013
Augmenting Social Reality in the Workplace
Tuesday, May 28. 2013
Arctic Instruments
 [Image: Via the Extreme Environments & Future Landscapes program].
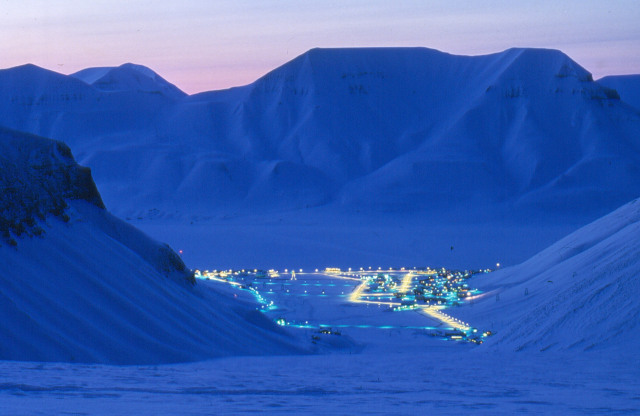
Returning briefly to the theme of landscape devices—particularly in the run-up to the launch of Landscape Futures—I thought I'd post a quick look at a trip to the Arctic island of Svalbard last autumn led by David Garcia with students from the University of Lund School of Architecture.
As part of Lund's Extreme Environments & Future Landscapes program, students flew up to visit "the far north, beyond the Polar Circle, to Svalbard, to study the growing communities affected by the melting ice cap and the large opportunities for transportation and resources that the northeast passage now offers."
 [Image: Via the Extreme Environments & Future Landscapes program].
There, the students would also research first-hand the performance of "urban structures in the extreme cold."
 [Images: From a series of "light beacon studies" by Marta Nestorov].
However, Garcia adds, during their time in the extreme environment of the north, the group also "tested and probed the surroundings with surveying equipment designed and built for the expedition, at urban and natural landscapes, from -30 degrees Celsius to overcast blackout weather."
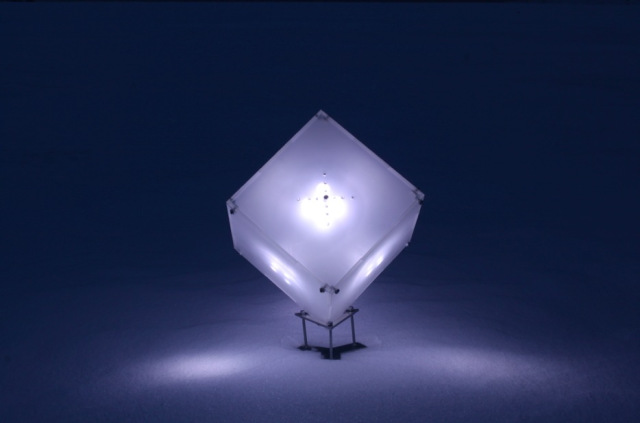
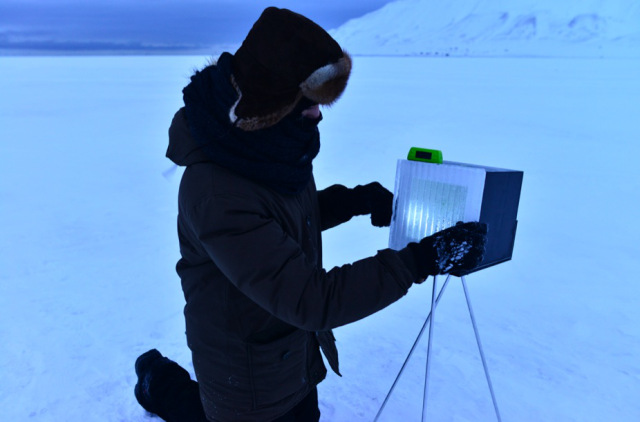
 [Image: An instrument for analyzing "perception and interpretation of the aurora borealis" by Christopher Erdman].
Some of that equipment is pictured here, ranging from a colorful audio device "used for testing sound absorption properties of snow" to a kind of portable oven meant for testing the thermal-insulation qualities of "ice tiles" that might someday be used in constructing frozen architecture.
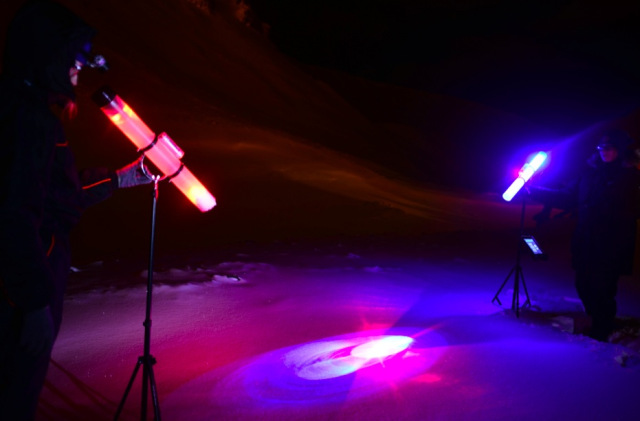
 [Image: Device "for testing sound absorption qualities of snow," by Milja Lindberg and Liina Pikk].
For their test of the acoustic properties of snow, for example, using tripods seen in the above photo, students Milja Lindberg and Liina Pikk designed an experiment that would operate "by transmitting sound onto snow and reflecting it to a receiver":
The device consists of three parts. A blue transmitter tube (Ø 60mm) sends focused sound frequencies through a speaker fitted at one end of the tube. A red receiver tube 20mm wider in diameter picks up sound waves reflected from the snow test bed. Both tubes are connected to tripods with an angle adjuster that works as a protractor to set the right angle. This piece also connects two lasers on top of the tubes. The lasers meet in the middle of the snow test bed.
 [Images: The aforementioned device "used for testing sound absorption qualities of snow," by Milja Lindberg and Liina Pikk].
The accompanying pink & lavender light show lent a strangely theatrical air to the operation—perhaps also inadvertently revealing the possibility of designing "architecture" in snow-intensive environments using nothing but colored light.

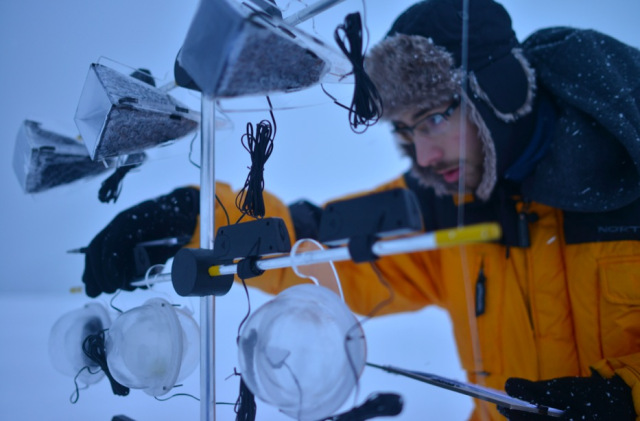 [Images: A device for performing "biomimicry of polar plants" by Clemens Hochreiter].
Clemens Hochreiter's installation for studying the "biomimicry of polar plants," meanwhile, was an attempt to reproduce the shapes of Arctic flowers in small translucent shells, in order to test—if I've understood this correctly—what architectural shapes might be most useful in future greenhouse design.
Hochreiter hoped to "clarify if it [is] possible to improve the microclimate within the flower shaped volumes by using transparent, translucent, light absorbing or light reflecting materials."
 [Image: Device for studying the "insulation properties and light transmission" of ice tiles, by Daniela Miller].
Continuing to move through the projects relatively quickly, we come to Daniela Miller's study, pictured above, which seems to be one of the more practical investigations of the bunch. Miller's goal was to analyze the ability of specially made "ice tiles" to insulate against heat loss as well as to transmit light.
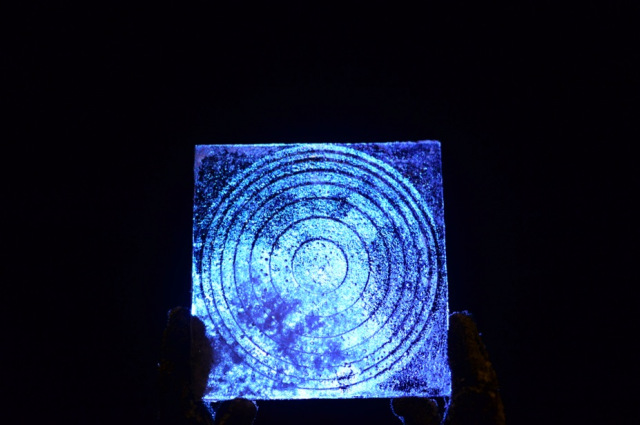

 [Images: Ice tiles by Daniela Miller].
"The tiles are produced in different thicknesses," Miller explains, "and some of them encase different kinds of material. Using a heat source within the box, the insulation properties of the tiles can be measured with a thermometer.
The other series of studies deals with the translucency of the tiles. A light source is placed inside the box and the light intensity and quality crossing through the tile can be measured with a luxmeter."
The "different ice and snow plates were produced by use of a mould system," she adds, and each tile was subsequently "registered and analyzed to quantify the most relevant data"; this was all part of her attempt to explore "the potential of benefiting from ice and snow in architecture."
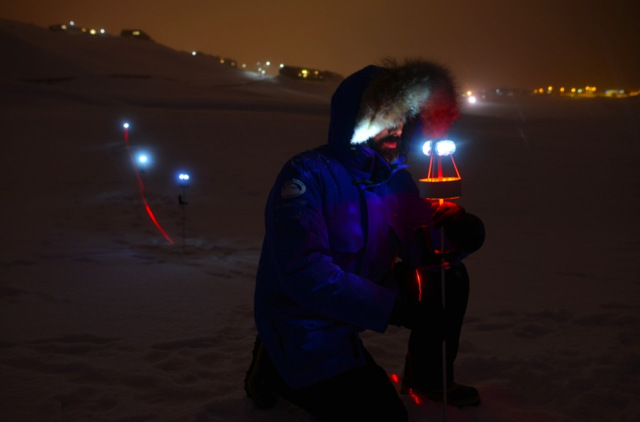

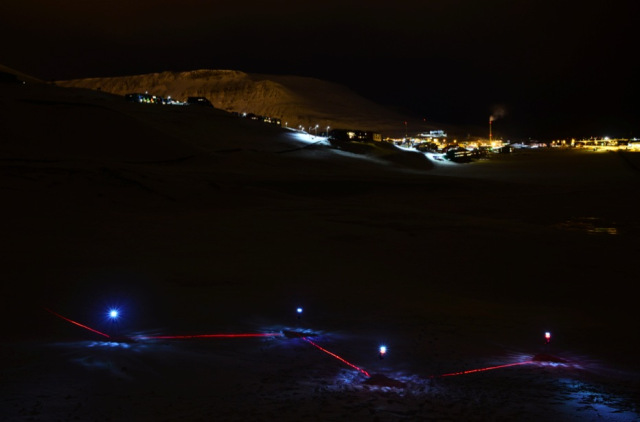
 [Images: A "polar bear alarm" by studio director David Garcia].
Finally, David Garcia himself built an alarm system for detecting polar bears, or what he calls "a 'soft' perimeter alarm, not one that will stop polar bears from approaching the designed area, but allows for an acoustic or visual alarm to be triggered."
Cue a team of screenwriters here to produce the world's first Arctic bear-heist film, in which enterprising 800-pound superthieves rumble up on a snow-covered city in the dark one winter and hatch a devious plan, subverting the red-laser alarm lights, slinking past optically-advanced high-tech fencing, and erasing their own paw-prints as they pull off the world's most spectacular case of ursine burglary. The Svalbard Job.
In any case, more images of other projects—and, in most cases, longer descriptions of each—are available on the expedition website.
Friday, May 10. 2013
Brooklyn Developer Offers Up His Personal Data on Kickstarter
Wednesday, May 08. 2013
Stephen Wolfram on Personal Analytics
-----
The creator of the Wolfram Alpha search engine explains why he thinks your life should be measured, analyzed, and improved.
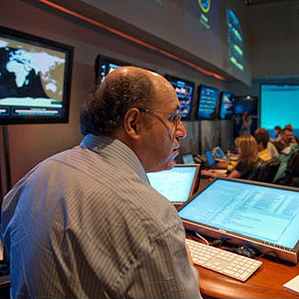
Personal control: Stephen Wolfram created the search engine Wolfram Alpha
Don’t be surprised if Stephen Wolfram, the renowned complexity theorist, software company CEO, and night owl, wants to schedule a work call with you at 9 p.m. In fact, after a decade of logging every phone call he makes, Wolfram knows the exact probability he’ll be on the phone with someone at that time: 39 percent.
Wolfram, a British-born physicist who earned a doctorate at age 20, is obsessed with data and the rules that explain data. He is the creator of the software Mathematica and of Wolfram Alpha, the nerdy “computational knowledge engine” that can tell you the distance to the moon right now, in units including light-seconds.
Now Wolfram wants to apply the same techniques to people’s personal data, an idea he calls “personal analytics.” He started with himself. In a blog post last year, Wolfram disclosed and analyzed a detailed record of his life stretching back three decades, including documents, hundreds of thousands of e-mails, and 10 years of computer keystrokes, a tally of which is e-mailed to him each morning so he can track his productivity the day before.
Last year, his company released its first consumer product in this vein, called “Personal Analytics for Facebook.” In under a minute, the software generates a detailed study of a person’s relationships and behavior on the site. My own report was revealing enough. It told me which friend lives at the highest latitude (Wicklow, Ireland) and the lowest (Brisbane, Australia), the percentage who are married (76.7 percent), and everyone’s local time. More of my friends are Scorpios than any other sign of the zodiac.
It looks just like a dashboard for your life, which Wolfram says is exactly the point. In a phone call that was recorded and whose start and stop time was entered into Wolfram’s life log, he discussed why personal analytics will make people more efficient at work and in their personal lives.
What do you typically record about yourself?
E-mails, documents, and normally, if I was in front of my computer, it would be recording keystrokes. I have a motion sensor for the room that records when I pace up and down. Also a pedometer, and I am trying to get an eye-tracking system set up, but I haven’t done that yet. Oh, and I’ve been wearing a sensor to measure my posture.
Do you think that you’re the most quantified person on the planet?
I couldn’t imagine that that was the case until maybe a year ago, when I collected together a bunch of this data and wrote a blog post on it. I was expecting that there would be people who would come forward and say, “Gosh, I’ve got way more than you.” But nobody’s come forward. I think by default that may mean I’m it, so to speak.
You coined this term “personal analytics.” What does it mean?
There’s organizational analytics, which is looking at an organization and trying to understand what the data says about its operation. Personal analytics is what you can figure out applying analytics to the person, to understand the operation of the person.
Why have you been analyzing Facebook data?
We are trying to feel out the market for personal analytics. Most people are not recording all their keystrokes like I am. But the one thing they are doing is leaving lots of digital trails, including on Facebook, and that is one of the pieces we’ve been experimenting with.
We’ve accumulated a lot of Facebook data—you’re seeing the story of people’s lives, played out in the level of data. You can see relationship status as a function of age, or the evolution of the clustering of friends at different ages. It’s really quite fascinating to see how all this stuff is just right there in the data.
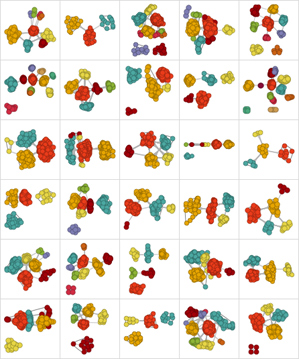
Social grid: People’s friend networks on Facebook are presented as cluster diagrams.
Isn’t a lot of what you find kind of obvious? Like friends from college aren’t connected to the ones from grammar school?
Yes, but then you get a case where the data analysis is buggy. You get some curve, and your reaction is, “Oh, yeah, I understand why the curve is that way, I’ve got an argument for it.” But then, oops, there was a bug in the analysis and actually the curve is something different. That reminds you things aren’t quite so obvious. If you actually measure it, that’s doing science.
What’s the connection to the search engine you built?
Right now Wolfram Alpha is strong on public knowledge: accumulating and searching the knowledge of the civilization. But what you have to do in personal analytics is try to accumulate the knowledge of a person’s life. Then the two can actually be integrated, and I’ll give a kind of silly example. You might ask: “Who do I know that can go out into their backyard and go and look at the night sky right now?” For that you have to be able to compute who is in nighttime, who doesn’t have cloudy weather, and things like this. And we can compute all that stuff.
What do you see as the big applications in personal analytics?
Augmented memory is going to be very important. I’ve been spoiled because for years I’ve had the ability to search my e-mail and all my other records. I’ve been the CEO of the same company for 25 years, and so I never changed jobs and lost my data. That’s something that I think people will just come to expect. Pure memory augmentation is probably the first step.
The next is preëmptive information delivery. That means knowing enough about people’s history to know what they’re going to care about. Imagine someone is reading a newspaper article, and we know there is a person mentioned in it that they went to high school with, and so we can flag it. I think that’s the sort of thing it’s possible to dramatically automate and make more efficient.
Then there will be a certain segment of the population that will be into the self-improvement side of things, using analytics to learn about ourselves. Because we may have a vague sense about something, but when the pattern is explicit, we can decide, “Do we like that behavior, do we not?” Very early on, back in the 1990s, when I first analyzed my e-mail archive, I learned that a lot of e-mail threads at my company would, by a certain time of day, just resolve themselves. That was a useful thing to know, because if I jumped in too early I was just wasting my time.
What technologies are needed to do personal analytics at a large scale?
It’s data science and the whole cluster of technologies that come with that. Then it’s having computational knowledge about the world and being able to make queries in natural language. Then you need to sense things about the world, whether it’s with sensors or being able to do visual recognition to know what one is seeing. Then the final thing is just all the plumbing infrastructure to get all of these devices to communicate and feed their information to a place where one can do analysis.
Where do you stand on commercializing these ideas?
The personal analytics of Facebook for Wolfram Alpha is a deployed project, and there will be more of those in the personal-analytics space. We think we can do terrific things, but you have to be able to get to the data. That has been the holdup. The data isn’t readily available. Recently we’ve been working with different companies to try and make sure we can connect their sensors to kind of a generic analytics platform, to take people’s data, move it to the cloud, and do analytics on it.
How much better do you think that people or organizations can become with some data feedback?
I think it will be fairly dramatic. It’s like asking how much more money can you make if you track your portfolio rather than just vaguely remembering what investments you made.
Related Links:
Driving Miss dAIsy: What Googles self-driving cars see on the road
Via Slash Gear via Computed·Blg
-----
We’ve been hearing a lot about Google‘s self-driving car lately, and we’re all probably wanting to know how exactly the search giant is able to construct such a thing and drive itself without hitting anything or anyone. A new photo has surfaced that demonstrates what Google’s self-driving vehicles see while they’re out on the town, and it looks rather frightening.

The image was tweeted by Idealab founder Bill Gross, along with a claim that the self-driving car collects almost 1GB of data every second (yes, every second). This data includes imagery of the cars surroundings in order to effectively and safely navigate roads. The image shows that the car sees its surroundings through an infrared-like camera sensor, and it even can pick out people walking on the sidewalk.
Of course, 1GB of data every second isn’t too surprising when you consider that the car has to get a 360-degree image of its surroundings at all times. The image we see above even distinguishes different objects by color and shape. For instance, pedestrians are in bright green, cars are shaped like boxes, and the road is in dark blue.
However, we’re not sure where this photo came from, so it could simply be a rendering of someone’s idea of what Google’s self-driving car sees. Either way, Google says that we could see self-driving cars make their way to public roads in the next five years or so, which actually isn’t that far off, and Tesla Motors CEO Elon Musk is even interested in developing self-driving cars as well. However, they certainly don’t come without their problems, and we’re guessing that the first batch of self-driving cars probably won’t be in 100% tip-top shape.
Electronic Sensors Printed Directly on the Skin
-----
New electronic tattoos could help monitor health during normal daily activities.
By Mike Orcutt on March 11, 2013
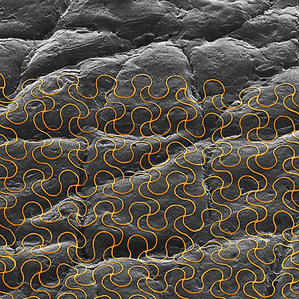
Electronic tattoo: The image shows a colorized micrograph of an ultrathin mesh electronic system mounted on a skin replica.
Taking advantage of recent advances in flexible electronics, researchers have devised a way to “print” devices directly onto the skin so people can wear them for an extended period while performing normal daily activities. Such systems could be used to track health and monitor healing near the skin’s surface, as in the case of surgical wounds.
So-called “epidermal electronics” were demonstrated previously in research from the lab of John Rogers, a materials scientist at the University of Illinois at Urbana-Champaign; the devices consist of ultrathin electrodes, electronics, sensors, and wireless power and communication systems. In theory, they could attach to the skin and record and transmit electrophysiological measurements for medical purposes. These early versions of the technology, which were designed to be applied to a thin, soft elastomer backing, were “fine for an office environment,” says Rogers, “but if you wanted to go swimming or take a shower they weren’t able to hold up.” Now, Rogers and his coworkers have figured out how to print the electronics right on the skin, making the device more durable and rugged.
“What we’ve found is that you don’t even need the elastomer backing,” Rogers says. “You can use a rubber stamp to just deliver the ultrathin mesh electronics directly to the surface of the skin.” The researchers also found that they could use commercially available “spray-on bandage” products to add a thin protective layer and bond the system to the skin in a “very robust way,” he says.
Eliminating the elastomer backing makes the device one-thirtieth as thick, and thus “more conformal to the kind of roughness that’s present naturally on the surface of the skin,” says Rogers. It can be worn for up to two weeks before the skin’s natural exfoliation process causes it to flake off.
During the two weeks that it’s attached, the device can measure things like temperature, strain, and the hydration state of the skin, all of which are useful in tracking general health and wellness. One specific application could be to monitor wound healing: if a doctor or nurse attached the system near a surgical wound before the patient left the hospital, it could take measurements and transmit the information wirelessly to the health-care providers.
Rogers says his lab is now focused on developing and refining wireless power sources and communication systems that could be integrated into the system. He says the technology could potentially be commercialized by MC10 (see “Making Stretchable Electronics”), a company he cofounded in 2008. If things go as planned, says Rogers, in about a year and half the company will be developing more sophisticated systems “that really do begin to look like the ones that we’re publishing on now.”
Monday, April 22. 2013
A new way to report data center's Power and Water Usage Effectiveness (PUE and WUE)
Via Computed.Blg via Open Compute Project
-----
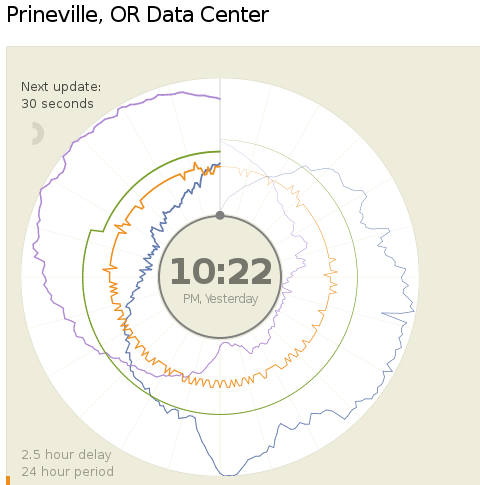
Today (18.04.2013) Facebook launched two public dashboards that report continuous, near-real-time data for key efficiency metrics – specifically, PUE and WUE – for our data centers in Prineville, OR and Forest City, NC. These dashboards include both a granular look at the past 24 hours of data and a historical view of the past year’s values. In the historical view, trends within each data set and correlations between different metrics become visible. Once our data center in Luleå, Sweden, comes online, we’ll begin publishing for that site as well.
We began sharing PUE for our Prineville data center at the end of Q2 2011 and released our first Prineville WUE in the summer of 2012. Now we’re pulling back the curtain to share some of the same information that our data center technicians view every day. We’ll continue updating our annualized averages as we have in the past, and you’ll be able to find them on the Prineville and Forest City dashboards, right below the real-time data.
Why are we doing this? Well, we’re proud of our data center efficiency, and we think it’s important to demystify data centers and share more about what our operations really look like. Through the Open Compute Project (OCP), we’ve shared the building and hardware designs for our data centers. These dashboards are the natural next step, since they answer the question, “What really happens when those servers are installed and the power’s turned on?”
Creating these dashboards wasn’t a straightforward task. Our data centers aren’t completed yet; we’re still in the process of building out suites and finalizing the parameters for our building managements systems. All our data centers are literally still construction sites, with new data halls coming online at different points throughout the year. Since we’ve created dashboards that visualize an environment with so many shifting variables, you’ll probably see some weird numbers from time to time. That’s OK. These dashboards are about surfacing raw data – and sometimes, raw data looks messy. But we believe in iteration, in getting projects out the door and improving them over time. So we welcome you behind the curtain, wonky numbers and all. As our data centers near completion and our load evens out, we expect these inevitable fluctuations to correspondingly decrease.
We’re excited about sharing this data, and we encourage others to do the same. Working together with AREA 17, the company that designed these visualizations, we’ve decided to open-source the front-end code for these dashboards so that any organization interested in sharing PUE, WUE, temperature, and humidity at its data center sites can use these dashboards to get started. Sometime in the coming weeks we’ll publish the code on the Open Compute Project’s GitHub repository. All you have to do is connect your own CSV files to get started. And in the spirit of all other technologies shared via OCP, we encourage you to poke through the code and make updates to it. Do you have an idea to make these visuals even more compelling? Great! We encourage you to treat this as a starting point and use these dashboards to make everyone’s ability to share this data even more interesting and robust.
Lyrica McTiernan is a program manager for Facebook’s sustainability team.
Personal comment:
The Open Compute Project is definitely an interesting one and the fact that it comes with open data about centers' consumption as well. Though, PUE and WUE should be questioned further to know if these are the right measures about the effectiveness of a data center.
I'm not a specialist here, but It seems to me that these values don't give an idea of the overall use of energy for a dedicated task (data and services hosting, remote computing), but just how efficient the center is (if it makes a good use or not or energy and water).
To resume it: I could spend a super large amount of energy and water, but if I do it in an efficient way, then my pue and wue will good and it will look ok on the paper and for the brand communication.
That's certainly a good start (better have a good pue and wue) and in fact all factories should publish such numbers, but it is probably not enough. How much energy for what type of service might or should become a crucial question in a close future, until we'll have an "abundance" of renewable ones!
fabric | rblg
This blog is the survey website of fabric | ch - studio for architecture, interaction and research.
We curate and reblog articles, researches, writings, exhibitions and projects that we notice and find interesting during our everyday practice and readings.
Most articles concern the intertwined fields of architecture, territory, art, interaction design, thinking and science. From time to time, we also publish documentation about our own work and research, immersed among these related resources and inspirations.
This website is used by fabric | ch as archive, references and resources. It is shared with all those interested in the same topics as we are, in the hope that they will also find valuable references and content in it.
Quicksearch
Categories
Calendar
|
|
May '24 | |||||
| Mon | Tue | Wed | Thu | Fri | Sat | Sun |
| 1 | 2 | 3 | 4 | 5 | ||
| 6 | 7 | 8 | 9 | 10 | 11 | 12 |
| 13 | 14 | 15 | 16 | 17 | 18 | 19 |
| 20 | 21 | 22 | 23 | 24 | 25 | 26 |
| 27 | 28 | 29 | 30 | 31 | ||
