Wednesday, March 03. 2010
Dan Hill - New Soft City
Wednesday, January 27. 2010
Les vertus nouvelles de la circulation circulaire de l'information
Les temps changent. Et la notion de « circulation circulaire de l’information », qui était vicieuse dans le discours du sociologue
Cette idée d’inversion de la valeur attachée à cette notion n’est pas de moi. Je l’ai lue quelque part, mais je ne souviens pas où. Je la fais donc circuler sans référence à la source, ce qui rompt un peu, précisément, le flux de circulation circulaire. A me lire ici, on pourrait croire que j’en suis la source, alors que je ne suis qu’un « circulateur » [1]… ![]() [2]
[2]
Mais j’ai un autre bon exemple sous la main. Suivez, pas à pas, le processus de circulation circulaire :
- un billet de Mathieu, relevant une perle dans le rapport Gaymard sur le livre ;
- cité par Nicolas Vanbremeersch, sur Meilcour ;
- lequel est cité par narvic, ici-même ;
- lequel est cité par Hubert Guillaud, sur La Feuille.
Dans cette chaîne, chacun de ceux qui citent renvoie vers tous ceux qui ont cité précédemment. Et le tout suscite, à chaque citation, une « grappe » de commentaires « sur place » de la part du lectorat particulier de chacun des « citateurs ».
Chacun des « citateurs » commente l’information initiale et la « reformate » à destination de son propre lectorat, permettant ainsi d’en accroître la diffusion. Le processus se propage « en grappe » lui-aussi, chaque point de citation étant potentiellement le noeud d’une nouvelle propagation. Le message initial se métamorphose durant le processus (avec probablement des pertes et des gains d’informations au passage : des simplifications ou des enrichissements), mais c’est - en définitive - la diffusion globale du message initial qui est accrue par ce processus « en avalanche »…
Il y a là de quoi réfléchir. C’est vraiment, à mon avis, un nouveau mode de circulation de l’information qui s’illustre ici : une circulation de noeud en noeud, au sein d’un réseau « en grappes ».
Ce modèle n’a que peu de chose à voir avec celui de la circulation de l’information dans les réseaux « traditionnels » des médias (presse écrite, radio, télévision), comme je le suggérais récemment (cette question fait partie de « mon programme de travail sur ce blog »).
Une idée de là où je veux en venir, dans cet article de Alexandre Steyer [3] et Jean-Benoît Zimmermann [4] : Influence sociale et diffusion de l’information (15 pages, en .pdf). Résumé :
La notion de diffusion, quel que soit son objet, est centrale pour tout système ou construction sociale, car elle se trouve à la base de la mise en cohérence des comportements des individus ou de leurs représentations, donc de la coordination de leurs actions. L’idée, à l’origine de la notion de diffusion, est que les interactions entre individus sont le moteur principal de l’évolution de leurs comportements, croyances ou représentations. Notre démarche dans cet article est celle des réseaux d’influence sociale, dans lesquels l’agent est situé dans une structure de nature résiliaire où la progression de l’influence est contingente d’effets de cumul. Après avoir exposé les principes d’un modèle de diffusion en réseau, fondé sur une dynamique de cheminement de l’influence sociale, nous étudions la manière dont cette influence se propage sous la forme d’« avalanches », donnant par là une importance fondamentale à la structure du réseau. Nous analysons comment le bruit, généré par ces avalanches constitue une signature de la structure sociale et peut en retour contribuer, par effet d’apprentissage, à modifier cette structure et donc la dynamique [de] diffusion. Nous expliquons alors pourquoi émergent des courbes de diffusion « critiques » singulières, en loi de puissance, au lieu de la forme exponentielle des courbes de diffusion traditionnelles.
Quand la blogosphère joue à plein de cette « circulation circulaire » de blog en blog, qui permet la formation d’effets de diffusion « en avalanche », les médias en ligne, dans leur logique de sites « portails de l’information », de « sites de destination », ne sont pas en mesure de le faire. Ils ne sont plus qu’un maillon dans une chaîne, et c’est la chaîne - non plus le média - qui assure la diffusion en ligne. Les journalistes n’ont pas encore pris conscience de cette nouveauté et ne s’y sont pas encore réellement adaptés : s’ils veulent jouer un rôle dans la diffusion de l’information, c’est dans la dimension sociale d’internet que ça se joue, c’est à dire hors de leur site et après la mise en ligne. C’est ce qui me pousse à penser que l’avenir du journalisme en ligne est dans l’immersion dans les réseaux sociaux du net, ce qui est une autre aspect de la question déjà posée précédemment : Les sites d’info doivent-ils migrer sur Facebook et dans les blogs ?
On va en reparler sur ce blog… ![]()
-----
Via Novövision
Personal comment:
Un commentaire très à propos par rapport à la nature même de ce blog de "veille" (celui de fabric | ch). J'aime assez l'idée et l'image d'"avalanche informationnelle", qui serait donc constituée par la masse des "reblogs" et autres "reposts" ou citations.
Merci à Nicolas Besson pour le lien.
Tuesday, January 05. 2010
The Trillion Node Network
Grand Tour of the Known Universe
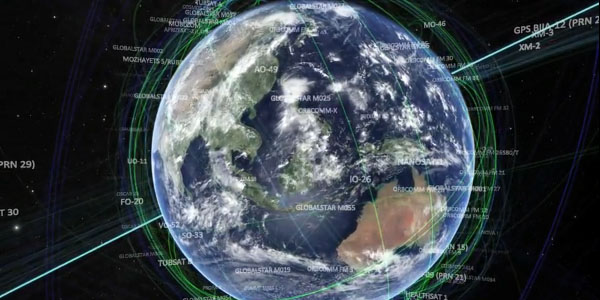
The movie titled "Known Universe" takes viewers from the Himalayas through our atmosphere and the inky black of space to the afterglow of the Big Bang. Every star, planet, and quasar seen in the film is possible because of the world's most complete four-dimensional map of the universe, the Digital Universe Atlas that is maintained and updated by astrophysicists at the American Museum of Natural History.
Every satellite, moon, planet, star and galaxy is represented to scale and its correct, measured location according to the best scientific research to-date.
Watch the video HERE.
-----
Thursday, December 10. 2009
Information Overload: Americans Consume 34 GB of Data Daily
They say the soul weighs 21 grams, and now we have a measurement of the American mind on any given day: 34 gigabytes. According to a University of California, San Diego, study highlighted by The New York Times, the average American consumes 34 GB worth of content a day, including a whopping 100,000 words of information.
The report clarifies that we don’t necessarily parse a full 100,000 words per day, but that that rather astounding figure does cross our eyes and ears each 24-hour interval via multiple channels: the Web, TV, text messaging, radio, video games and more.
The study goes on to break down which of those media tend to occupy most of our time. The big winner is still television at almost 45 percent of our daily allowance, but the computer is a not-too-distant second at about 27 percent. In all, we spend about 11.8 hours per day absorbing mass quantities of information, sometimes multitasking in front of multiple screens simultaneously.

Video games saw the biggest leap in recent years; we now spend 2.5 percent of the day on computers, consoles, and on an increasingly popular selection of social networking games like FarmVille and Pet Society. And although pundits and sociologists have been quick to decry the decline of print as a corresponding decline in literacy, the increase in time spent on the Web actually means people are “reading more than ever,” according to co-author of the study Roger Bohn.
Do the results of the study seem realistic to you? Would you classify yourself as above or below the American average in your data consumption diet?
[via Lifehacker]
[img credit: iStockphoto, enot-poloskun]
-----
Via Mashable
Information Is Beautiful
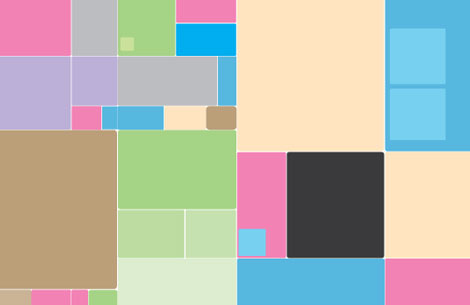
David McCandles is a London-based author, writer and designer who’s website is called Information Is Beautiful. I’ve never heard of an ‘independent visual and data journalist, but I have now, and think I like them. Tons of great information graphics and a weighty client-base to boot.
“My pet-hate is pie charts. Love pie. Hate pie-charts.”
www.informationisbeautiful.net
-----
Via It's Nice That
Personal comment:
Just a resource and a blog about well designed information design... project.
Friday, December 04. 2009
Eko: A Traffic Light Augmented by Progress Bars

The Ecological and Economical Traffic Light Concept [relogik.com] by Damjan Stankovic is a Red Dot Design 2009 Award winner and consists of a simple yet, potentially highly practical visualization concept for everyday traffic lights that could reduce pollution and promote safer driving. There might already be quite some traffic light time counters around today, but few focus on informing the car drivers in a physically integrative and visually glanceable way like this proposed design concept.
Eko Light is specifically designed so it can be easily installed onto existing traffic light systems without much effort. It claims to bring forward following benefits:
- Less pollution, as drivers can turn their engines off and cut carbon emissions while waiting for the green light,
- Less fuel consumption, as turning off vehicle engines lowers fuel consumption in the long run,
- Less stress, since drivers know exactly how long to wait, and
- Safer driving, as all traffic participants are fully aware of how much time they have left before the light changes, reducing the chance for potential traffic accidents.
-----
Spam Visualization: Revealing Trackback & Comment Spam Patterns
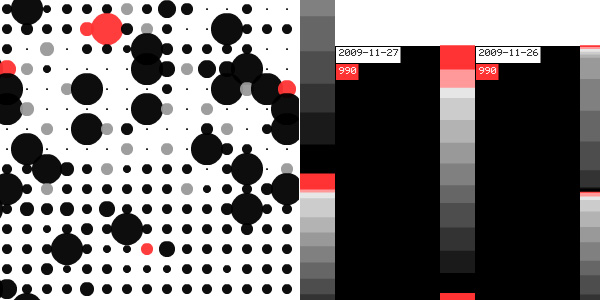
Spam Visualization [spamvisualization.net] contains a small collection of beautifully stylized data visualizations based on the data retrieved from the Spam Catalog Database.
The available data visualization techniques include a Bubble Size Quantity Grid (sorted by date, size or IP number), a Word Frequency Graph (sorted by count, alphabet or length), a Top Level Pie Chart (the circles show the ratio of the toplevel domain endings in emails and link URLs), some IP Number Glyphs, and a Time Frequency Bar Graph (shows the spam income of the last seven days, with color depending on the amount per hour.).
More visuals are available at Flickr. Thnkx Kim.
-----
Thursday, October 22. 2009
Data.gov.uk Newspaper: Opening Up Local Information as a Newspaper
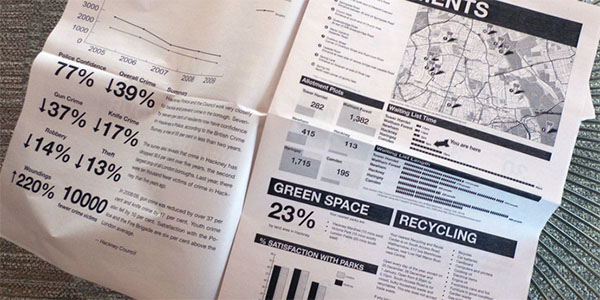
The data.gov.uk Newspaper [newspaperclub.co.uk] is a tangible prototype of a potential service targeting people who recently moved into a new area, and shows information about the area, such as local services, environmental information, crime statistics, travel times, transportation options, education and healthcare.
The current project acts as a prototype / working demonstration of the creative and original possibilities that are possible when governments would open some of the valuable datasets they have currently in their position. It also hopes to encourage some more data to get opened up to the public.
Also on Nodalities. Via @blprnt.
-----
Wednesday, September 30. 2009
Google Earth 3D Climate Change Simulator Unveiled - Starring Al Gore
fabric | rblg
This blog is the survey website of fabric | ch - studio for architecture, interaction and research.
We curate and reblog articles, researches, writings, exhibitions and projects that we notice and find interesting during our everyday practice and readings.
Most articles concern the intertwined fields of architecture, territory, art, interaction design, thinking and science. From time to time, we also publish documentation about our own work and research, immersed among these related resources and inspirations.
This website is used by fabric | ch as archive, references and resources. It is shared with all those interested in the same topics as we are, in the hope that they will also find valuable references and content in it.
Quicksearch
Categories
Calendar
|
|
May '24 | |||||
| Mon | Tue | Wed | Thu | Fri | Sat | Sun |
| 1 | 2 | 3 | 4 | 5 | ||
| 6 | 7 | 8 | 9 | 10 | 11 | 12 |
| 13 | 14 | 15 | 16 | 17 | 18 | 19 |
| 20 | 21 | 22 | 23 | 24 | 25 | 26 |
| 27 | 28 | 29 | 30 | 31 | ||
