Friday, January 16. 2009
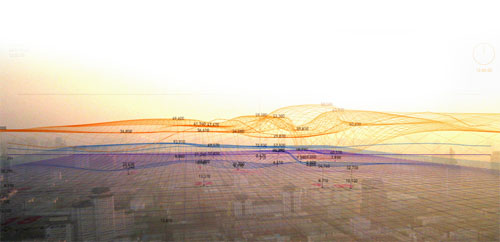
"In the Air" [intheair.es] aims to make visible the microscopic and invisible agents contributing to Madrid's air quality (e.g. gases, particles, pollen, diseases, etc) to investigate how they perform, react and interact with the rest of the city.
The project, developed as part of the Visualizar'08 workshop, consists of 2 complementary parts. First, a web-based dynamic model interpolates and relates different datasets in a 3D geographical overlay that can be interactively navigated. Secondly, a physical prototype titled "diffuse façade" acts as a massive indicator of the air´s components through a changing cloud. The colors and spray rhythms of the clouds emitted by a series of water vapor diffusors inform passers-by of the levels of several chemical air components (e.g. nitrogen monoxide, carbon dioxide, methane, sulfur dioxide, nitrogen dioxide, chlorine and carbon monixide), as measured by a nearby air quality sensor station.
-----
Via Information aethetics
Personal comment:
Un coucher de soleil de données (climatiques): même si ici cela ne semble pas encore être réalisé en "temps réel" et si l'image bloguée est un montage, il faut s'habituer à ce type de "mashup" mixant visualisaton de donnée et images captées dans le réel, physique.
Par ailleurs, les mouvement des masses d'air créent des formes ou plutôt des systèmes intéressants, avec zones de dépression, couches et mélanges de couches. A chacune de ces couches, une condition climatique différente: comment habiterait-on un tel organisme constitué de variations de qualité d'air?
Cette question renvoie partiellement, pour une réponse, au projet que Philippe Rahm a réalisé au CCA et dans lequel fabric | ch a collaboré: form & functions follow climate (voir lien ci-dessus).
Thursday, December 18. 2008
The Yomiuri Shimbun
OSAKA--In a world first, a research group in Kyoto Prefecture has succeeded in processing and displaying optically received images directly from the human brain.
The group of researchers at Advanced Telecommunications Research Institute International, including Yukiyasu Kamitani and Yoichi Miyawaki, from its NeuroInformatics Department, said about 100 million images can be read, adding that dreams as well as mental images are likely to be visualized in the future in the same manner.
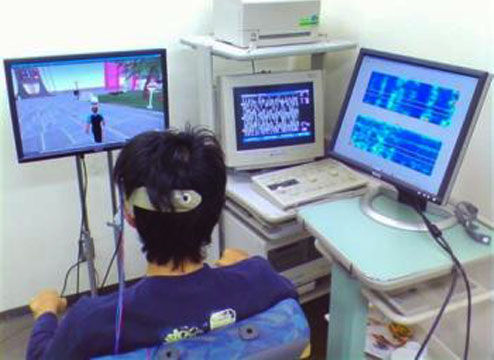
Optically received images are converted to electrical signals in the retina and treated in the brain's visual cortex.
In the recent experiment, the research group asked two people to look at 440 different still images one by one on a 100-pixel screen. Each of the images comprised random gray sections and flashing sections.
The research group measured subtle differences in brain activity patterns in the visual cortexes of the two people with a functional magnetic resonance imaging (fMRI) scanner. They then subdivided the images and recorded the subjects' recognition patterns.
The research group later measured the visual cortexes of the two people who were looking at the word "neuron" and five geometric figures such as a square and a cross. Based on the stored brain patterns, the research group analyzed the brain activities and reconstructed the images of Roman letters and other figures, succeeding in recreating optically received images.
Wednesday, December 10. 2008
http://www.iht.com/articles/2008/12/08/arts/design8.php
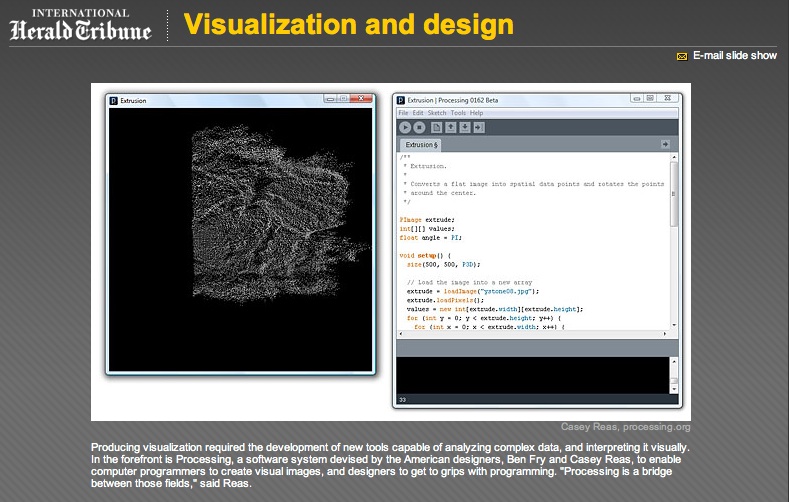
(...) There's one simple reason why visualization is becoming so important, and that's our desire to understand what's happening in the world at a time when it's becoming harder and harder to do so. "Design always moves where it is needed most," said Paola Antonelli, curator of Design and the Elastic Mind, who is now working on a major visualization project. "The surge in computing power has generated a surge in information output, and heated up interest in visualization design." (...)
------
Via Beyond the Beyond (Bruce Sterling)
Personal comment:
Paola Antonelli est curatrice pour le design au MOMA de New-York.
Si le MOMA se met à clairement exposer les processus et créateurs issus de la scène "digitale", le temps est venu pour que la discipline campe sur les devant de la scène créatrice après plusieurs années de critiques par la "vielle garde" conservatrice du design (qui va maintenant évidemment suivre et emboîter le pas).
Ce n'est d'ailleurs pas pour rien que l'on a vu récemment Casey Reas (Mr. Processing) faire soin entrée dans un classement des cent personnes les plus influentes actuellement dans le monde monde de l'art (le "power 100", artistes, curateurs, théoriciens et collectionneurs confondus) effectué par le magazine Art Review (voir: http://blog.fabric.ch/index.php?/archives/176-Art-Reviews-Power-100.html).
How could a NFL game like this gathered so much national attention : a dysfunctional organization vs underachiever at the week lowest possible viewers’ broadcast - Thursday night football? Both are the losers’ teams of the rich-n-wealthy state of California? No, it was the league historical moment- first ever NFL game shot and live broadcast in 3rd dimensional, and it was aired in HD too. Now that the game was over and since it was broadcasted in selected theaters, and only a few fortunate invitees got to see it; let’s see what the viewers thought about the full digital 3D sport.
Yahoo Tech reported few technical glitches here and there; couple feeds were blacked out in the first half of the same, viewings pulling the goggle off due to few weird effect with sudden camera movement and refocusing. Overall; the audiences love the 3D visual effects despite a dull match-up.
What about the polarized glasses and did it work? The Boston media described the technology in detail “Once your eyes adjusted to the glasses, which didn’t take long, the visuals were stunning, the picture sharp, and when the graphics came up on the screen, you felt as if you could reach out and pluck them off with your fingers.”
The game has not decided the future of 3D sport, but it certainly sparked a few interested parties. The league, team owners and broadcasting committee will meet and discuss the possibility some time before March. Now, guess where the next 3D HD football live broadcast will be? BCS Championship to be held at Miami and live broadcast at CES show 2009! A few lucky us will be there.
Monday, November 17. 2008
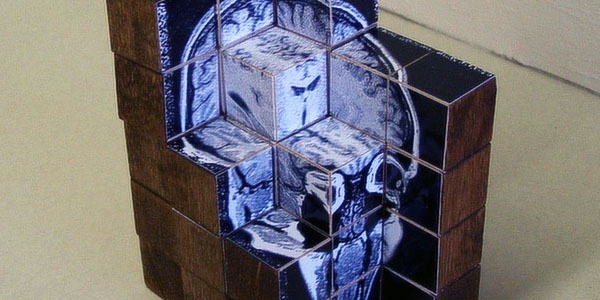
Neil Fraser, a software engineer at Google, took 9 carefully selected cross sections from a MRI scan and glued them on wooden blocks to create a 3D representative model [fraser.name]. The result is a collection of 60 1-inch cubes, of wich 94 outside faces are simply varnished, and 266 internal faces feature a square slice of the MRI images. One can then "dig" into the brain to carve out custom shapes.
Using touch as well as the third dimension to explore 3D data is an interesting avenue, as alternative interfaces need to be explored as much as representation.
Martin Ouellette is President and Creative Director of Provokat, one of Canada's leading digital adveritsing agencies. For him, infoviz is more than a simple discipline, it's a culture phenomenon.
-----
Via Information Aethetics
Thursday, October 09. 2008

Binary Waves, St. Denis, Paris, [ fr ]
LAB[au] (Manuel Abendroth, Jérôme Decock, Alexandre Plennevaux and Els Vermang) presents its new large scale urban installation Binary Waves in the context of the Art Grandeur Nature Biennale of Paris. fLUX, Binary Waves is an urban and cybernetic installation based on the measuring of infrastructural (passengers, cars) and communicational (electromagnetic fields produced by mobile phones, radio..) flows and their transposition into luminous, sonic and kinetic rules. This relation between the installation and the urban activity happens in real time and sets each person as an element of the installation, as a centre of public realm.
Sunday, August 31. 2008

Data can be organized many ways on Many Eyes. Above is a chart of Olympic medals.
By ANNE EISENBERG
Published: August 30, 2008
PEOPLE share their videos on YouTube and their photos at Flickr. Now they can share more technical types of displays: graphs, charts and other visuals they create to help them analyze data buried in spreadsheets, tables or text.
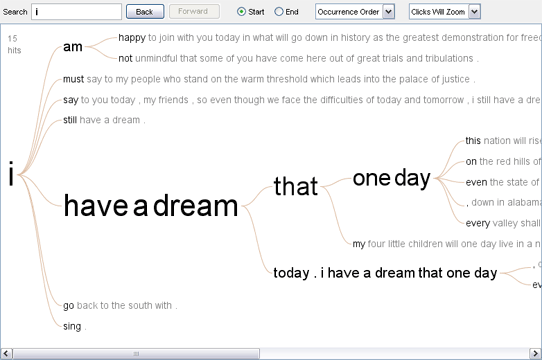
At an experimental Web site, Many Eyes, (www.many-eyes.com), users can upload the data they want to visualize, then try sophisticated tools to generate interactive displays. The site was created by scientists at the Watson Research Center of I.B.M. in Cambridge, Mass., to help people publish and discuss graphics in a group. Those who register at the site can comment on one another’s work, perhaps visualizing the same information with different tools and discovering unexpected patterns in the data.

Friday, July 25. 2008
Flickrvision - A Global View of Flickr Uploads from digitalurban on Vimeo.
The movie above illustrates Flickrvision, a near real-time update displaying geolocated images uploaded to the photo sharing site Flickr. Updates can be viewed via either Google Maps or in their new custom 3D Earth view. We have it running on a screen in the office as its simply fascinating (some would say hypnotic) to sit back and watch images being uploaded according to location. Twittervision offers the same but with tweets replacing images, it is almost more compulsive viewing to see what people are twitting about around the globe. Flickrvision and Twittervision are coded by David Troy
View Flickrvision
View Twittervision
From Digital Urban (Smithee)
|


