Wednesday, July 14. 2021
Interview with Patrick Keller fabric | ch, HEK Blog (Basel, 2020) | #satellite #daylight #device
Note: Patrick Keller (fabric | ch) was in discussion with curator Sabine Himmelsbach, from Haus der elektronischen Künste in Basel (CH), about their new acquisition for the collection of the Museum: Satellite Daylight 47°33'N.
The piece will be displayed permanently in the public space of the HeK. At least until breakdown... But interestingly, it is also part of a whole program of digital conservation at HeK that should prevent its technological collapse, for which we had to follow a tight protocol of documentation and provide the source code pf the work.
-----

fabric | ch, Satellite Daylight, 47°33‘N, 2020, Vue de l'installation durant «Shaping the Invisible World», 2021, HeK. Photo.: P. Keller.
Shooting set in preparation ...

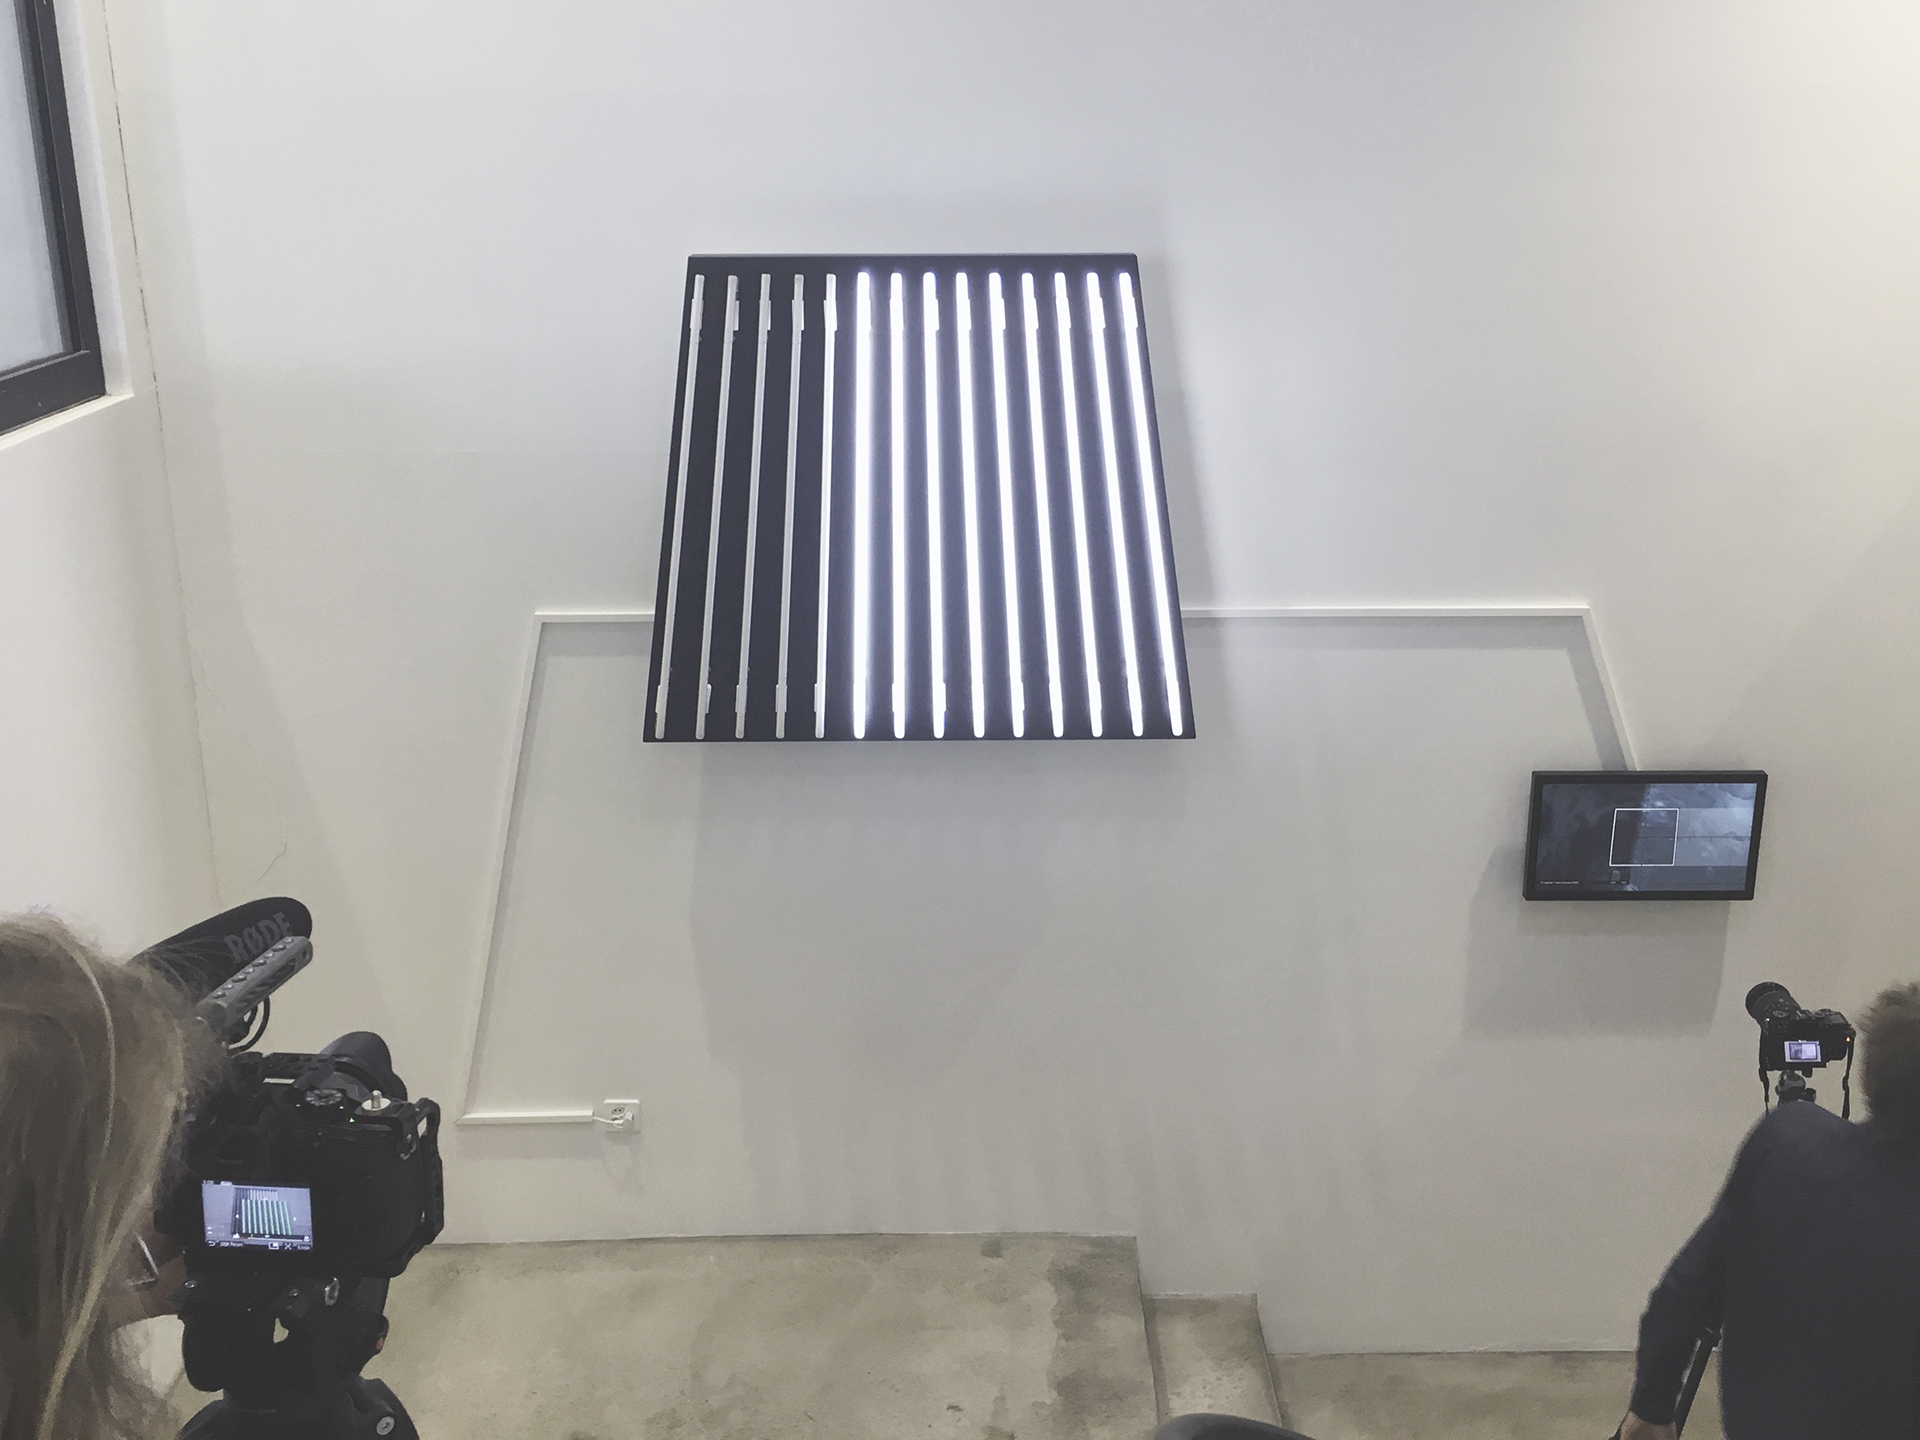
Followed by our discussion with Sabine Himmelsbach ... (with a lot of reverb in the staircase!)
-----
Via Haus der elektronischen Künste (blog)
Patrick Keller of fabric | ch, a studio for architecture, interaction and research in Lausanne, provides thrilling insight about the new work installed in the staircase of HeK.
Patrick Keller of fabric | ch, a studio for architecture, interaction and research in Lausanne, provides information about the new work in an interview. The installation Satellite Daylight, 47°33’N, commissioned for the HeK collection, simulates the light registered by an imaginary meteorological satellite orbiting the earth at the latitude of Basel at a speed of 7541m/s.
fabric | rblg
This blog is the survey website of fabric | ch - studio for architecture, interaction and research.
We curate and reblog articles, researches, writings, exhibitions and projects that we notice and find interesting during our everyday practice and readings.
Most articles concern the intertwined fields of architecture, territory, art, interaction design, thinking and science. From time to time, we also publish documentation about our own work and research, immersed among these related resources and inspirations.
This website is used by fabric | ch as archive, references and resources. It is shared with all those interested in the same topics as we are, in the hope that they will also find valuable references and content in it.
