Friday, July 16. 2010
Vincent Fournier


Photographer Vincent Fournier has a strong focus on the scientific, charting astronaut training fields through to antarctic research bases. His work captures the beauty and often otherworldly disconnection from reality found on the extremes of scientific research.
In a large majority of his landscape photos it’s easy to draw a comparison to Sci-Fi epic’s like Star War’s planets of Tatooine (home of Luke Skywalker) and the snow planet of Hoth. Did someone just spot an AT-AT?
Spotted in this months always inspiring issue of WIRED UK magazine.
Related Links:
Personal comment:
We already blogged about this photographer. But some truely additionnal great images from Vincent Fournier in which we definitely like the alien strangeness, the exploration feeling that comes out of his pictures about earth territories.
Thursday, July 15. 2010
Flexible displays in webOS's (distant) future?
Via PreCentral
-----
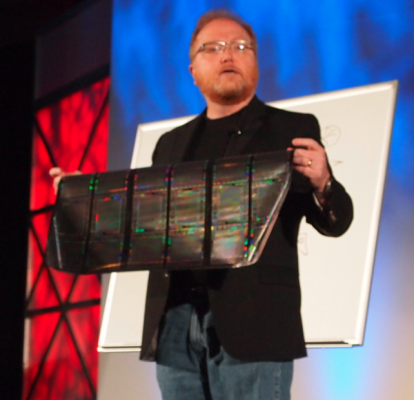
As we mentioned in our liveblog and wrap-up of Phil McKinney's keynote at MobileBeat 2010, HP's CTO was very clear that he wasn't announcing any new hardware - he likes webOS's chances on a "Slate device" but not on the Slate device.
McKinney also broke out both a Palm Pre and a Palm Pixi, but the most interesting thing he pulled out during his speech was a rolled-up flexible display. What you're looking at is something from deep inside HP's R&D, it's similar to E-Ink, printed on Mylar, and essentially can be made into any size you can imagine, from handset on up to an entire wall. It's full color and low-power, but more notably it's a far-in-the-future kind of thing, don't expect flexible display devices in the short or even medium term. The display that McKinney showed is still fairly fragile, even rolled up in a protective tube it managed to collect some kinds and flaws.
The takeaway? While HP really is dedicated to webOS smartphones, this flexible display technology is a sign that HP is thinking big about mobility.
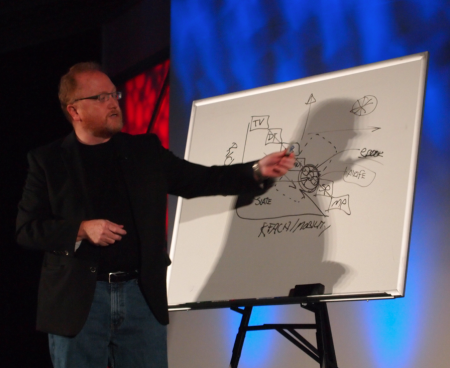
McKinney's goal for webOS is to break out of the spectrum of devices with television on one end and featurephones on the other, to create something that is both richly immersive and highly mobile with fewer tradeoffs than what current devices face. That asterisk off in the upper right, unbound from the line of non-mobile-but-rich televisions and highly-mobile-but-boring featurephones is the target.
Google climate map offers a glimpse of a 4C world
Via The Guardian (environment blog)
-----
By Adam Vaughan
Interactive tool layering climate data over Google Earth maps shows the impact of an average global temperature rise of 4C

Think it's hot this summer? Wait until you see Google's simulation of a world with an average global temperature rise of 4C.
Using a map that was first launched by the former Labour administration in October 2009, the coalition government has taken temperature data from the Met Office Hadley Centre and other climate research centres and imposed it on to a Google Earth layer.
It's a timely arrival, with warnings this month that current international carbon pledges will lead to a rise of nearly 4C and the Muir Russell report censuring some climate scientists for not being more open with their data (but exonerating them of manipulating the scientific evidence).
Unlike a similar tool using IPCC data that was launched by Google in the run-up to the Copenhagen climate conference last year, this map will be updated regularly with new data. It also has a series of YouTube videos of experts across the globe, with Met Office staff talking about forest fires in sub-Saharan Africa and researchers at the Tyndall Centre for Climate Change Research explaining sea level rises. To go more in-depth you can follow links to government sites, such as this one on water availability in a warming world.
Playing with the layer is surprisingly addictive, mainly thanks to Google Earth's draggable interface. Unlike the static map of last year, it also has the bonus of showing more obviously how temperature rises will differ drastically around the world. The poles glow a red (a potential rise of around 10C) while most of northern Europe escapes with light orange 2-3C rises. Other hotspots, such as Alaska, the Amazon and central Asia, also stand out.
Neatly, you can turn different climate "impacts" on and off. If you just want to see which regions will be worst affected by sea level rises - such as the UK and Netherlands as well as low-lying island states - you can. One limitation is that you have to zoom out to continental level to see the layer: if you're zoomed on your street, you can't see it.
Climate change minister Greg Barker launched the map today alongside the government's chief scientist, Prof John Beddington. Barker said: "This map reinforces our determination to act against dangerous man-made climate change. We know the stakes are high and that's why we want to help secure an ambitious global climate change deal."
The layer, of course, isn't the only one with an environmental theme to land on Google Earth. The UN's environment programme has one showing deforestation, WWF has a layer highlighting its projects across the globe and Google even has its own climate change "tours" for Google Earth. What other good green Earth layers have you stumbled across? And how do you rate the newest addition from the UK government?
• The KML layer of The impact of a global temperature rise of 4C is available now (you'll need a browser plug-in or the Google Earth app installed to view it)
Personal comment:
An interface and layer (Google Earth) to monitor the evolution of the predictions about climate. Should be updated as knowledge evolves.
Which brings a thought to our recent Arctic Opening project as it shoes that the arctic region will be dramatically hit by the rises of temperatures on the Globe.
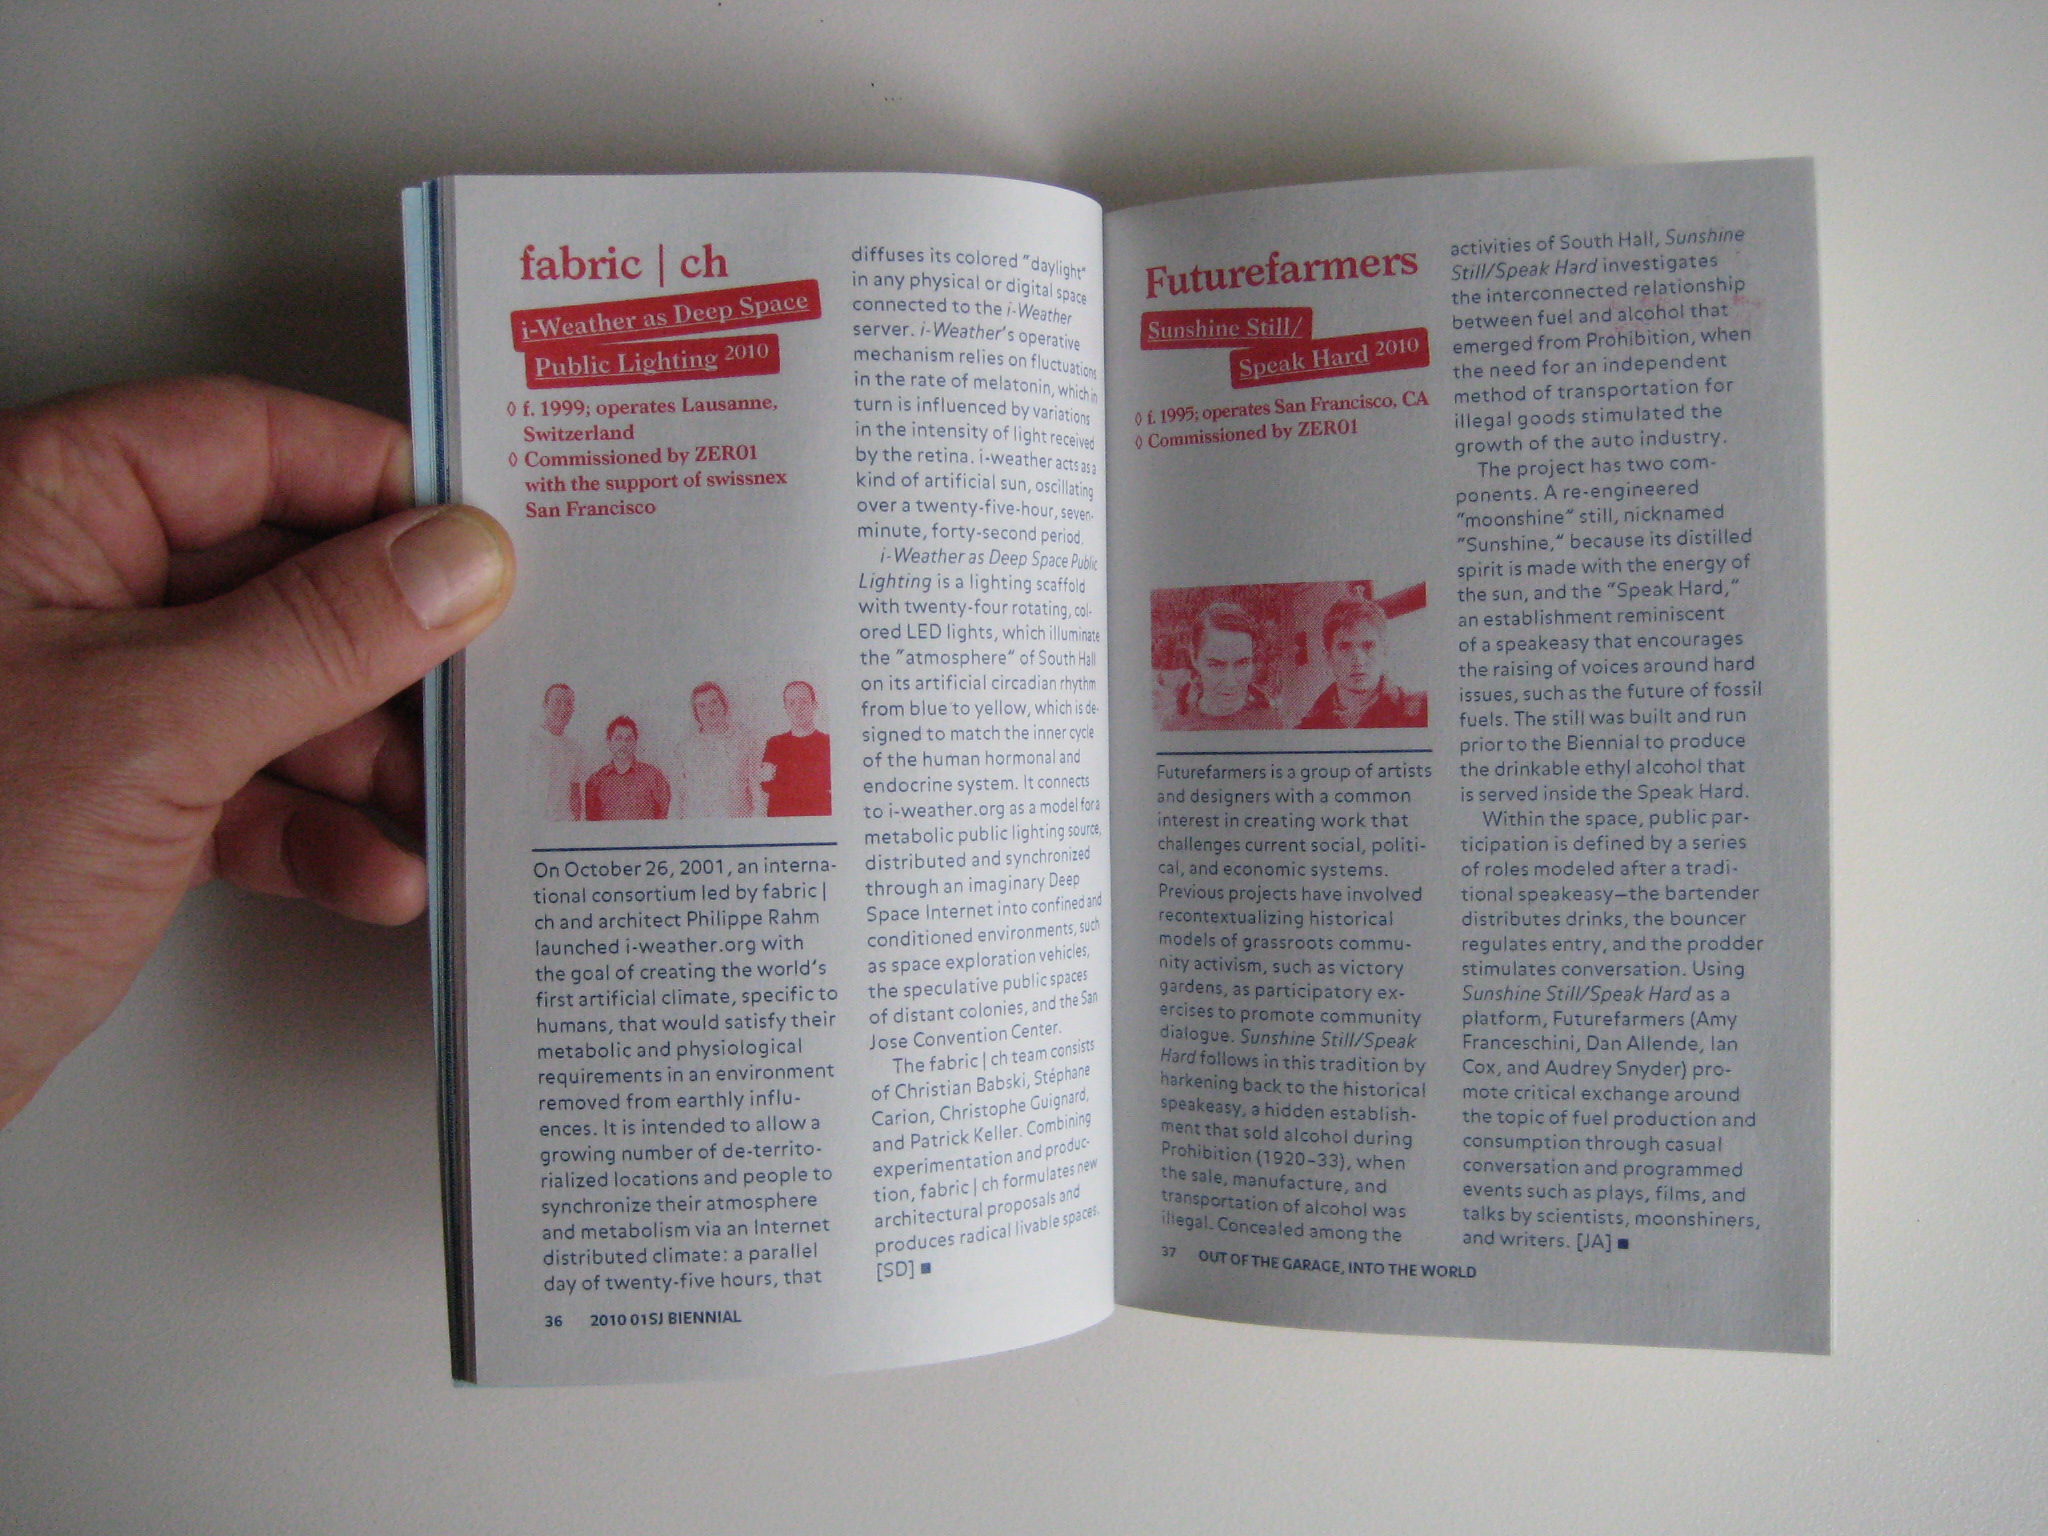
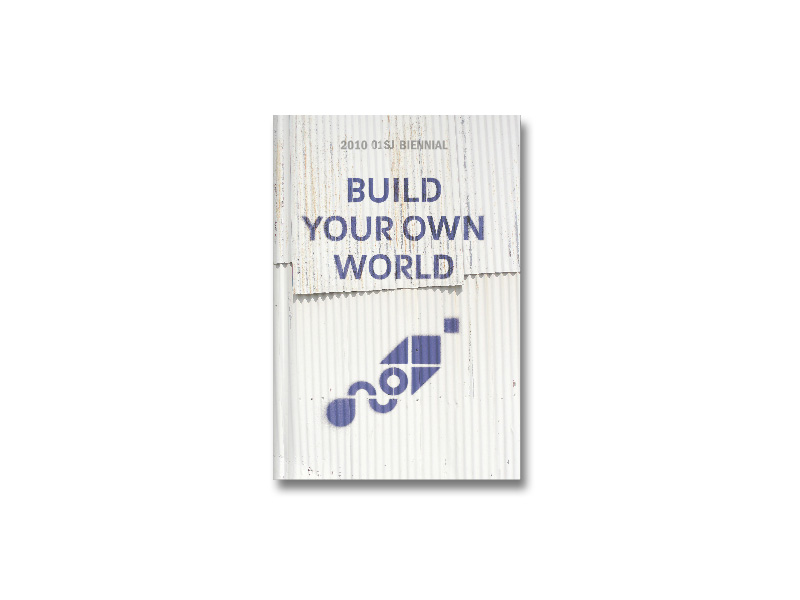
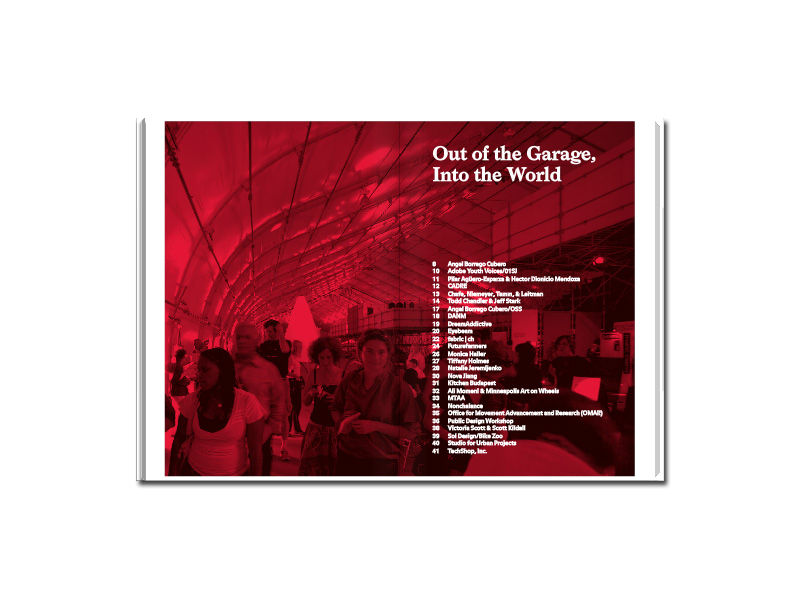
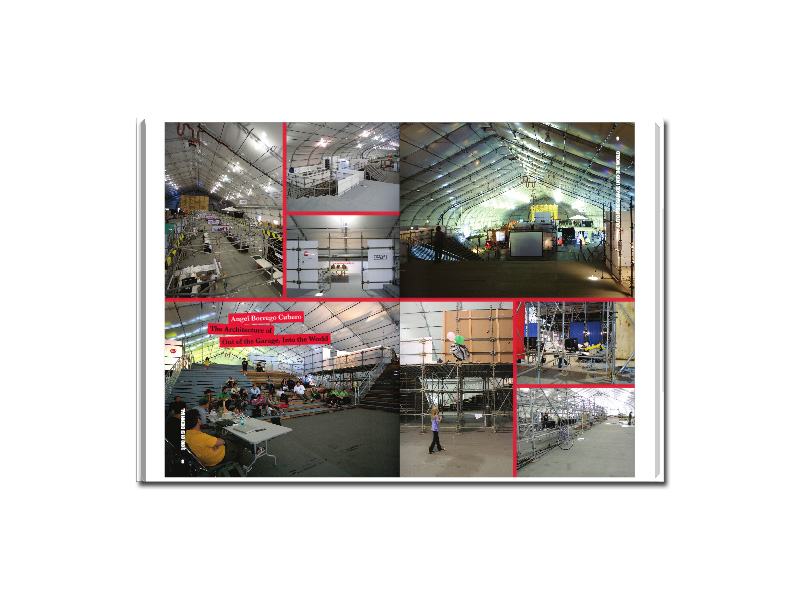
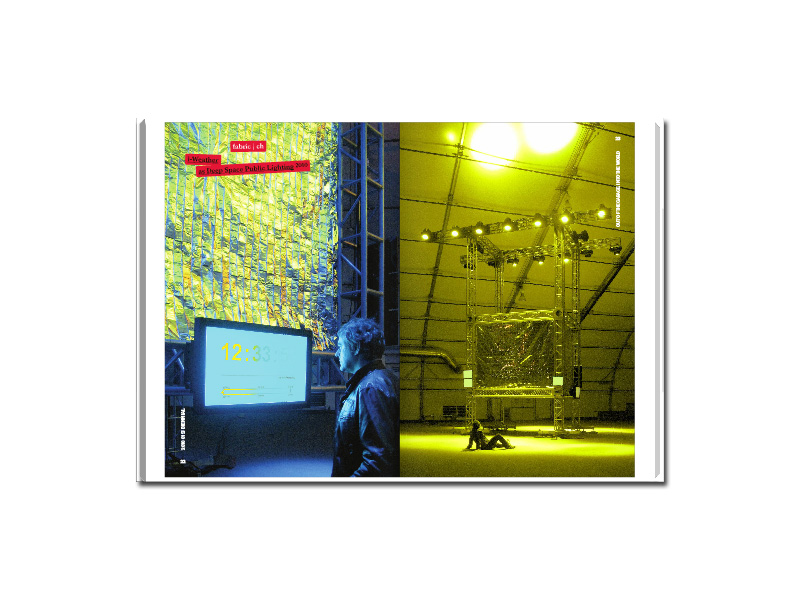
"fabric | ch", Build Your Own World (cur. S. Dietz), 01 San Jose (San Jose CA, 2010)

fabric | rblg
This blog is the survey website of fabric | ch - studio for architecture, interaction and research.
We curate and reblog articles, researches, writings, exhibitions and projects that we notice and find interesting during our everyday practice and readings.
Most articles concern the intertwined fields of architecture, territory, art, interaction design, thinking and science. From time to time, we also publish documentation about our own work and research, immersed among these related resources and inspirations.
This website is used by fabric | ch as archive, references and resources. It is shared with all those interested in the same topics as we are, in the hope that they will also find valuable references and content in it.
