Tuesday, March 24. 2009
Brain Images Reveal the Secret to Higher IQ
 |
||||
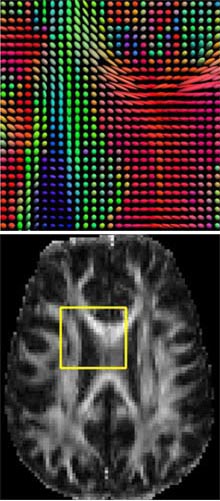
| Pixilated brain: At the bottom, an MRI image shows a slice of the human brain. At the top is shown a magnified portion of this section, created using diffusion imaging. To create the image, scientists measured the direction of the water diffusion in brain tissue. The "flower petals" at each point show the directions of fastest diffusion. These are aligned along the neural pathways of the brain, because water diffuses directionally along the well-insulated neural wires that carry electrical signals. The different directions of diffusion are color-coded red, green, and blue. In this example, the bright red areas reveal the thick fiber tract, called the corpus callosum, which transfers information between the left and right sides of the brain. Credit: David Shattuck, Arthur Toga, Paul Thompson/UCLA |
||||
|
Multimedia
|


The findings, which result from a detailed study of twins' brains, hint at how ever-improving brain-imaging technology could shed light on some of our most basic characteristics.
"The study answers some very fundamental questions about how the brain expresses intelligence," says Philip Shaw, a child psychiatrist at the National Institute of Mental Health, in Bethesda, MD, who was not involved in the research.
The neural wires that transmit electrical messages from cell to cell in the brain are coated with a fatty layer called myelin. Much like the insulation on an electrical wire, myelin stops current from leaking out of the wire and boosts the speed with which messages travel through the brain--the higher quality the myelin, the faster the messages travel. These myelin-coated tracts make up the brain's white matter, while the bodies of neural cells are called grey matter.
White matter is invisible on most brain scans, but a recently developed variation of magnetic resonance imaging, called diffusion-tensor imaging (DTI), allows scientists to map the complex neural wiring in our brains by measuring the diffusion of water molecules through tissue. Thanks to the fatty myelin coating, water diffuses along the length of neural wires, while in other types of brain tissue it moves in all different directions. Researchers can calculate the direction of fastest diffusion at each point in the brain and then construct a picture of the brain's fiber tracts. A well-organized brain has well-functioning myelin, in which water can be seen clearly moving along specific paths. "Diffusion imaging gives a picture of how intact your brain connections are," says Paul Thompson, a neuroscientist at the University of California, Los Angeles, who lead the study.
Thompson and his colleagues took DTI scans of 92 pairs of fraternal and identical twins. They found a strong correlation between the integrity of the white matter and performance on a standard IQ test. "Going forward, we are certainly going to think of white matter structure as an important contributor of intelligence," says Van Wedeen, a neuroscientist at Massachusetts General Hospital in Boston, who was also not involved in the research. "It also changes how you think about what IQ is measuring," says Wedeen. The research was published last month in the Journal of Neuroscience.
 |
| IQ inheritance: By comparing the brain scans of twins, scientists discovered that the quality of the fatty tissue that insulates neural wires is largely inherited. The parietal lobe, which is involved in logic and mathematics, is 85 percent genetically determined, whereas the visual cortex is about 76 percent, and the temporal lobe, which is involved in learning and memory, is only 45 percent genetically determined. Credit: David Shattuck, Arthur Toga, Paul Thompson/UCLA |
If white matter is linked to both processing speed and IQ, this raises the question: is intelligence merely a function of how fast your brain works? Previous research has linked processing speed to IQ, but the tests used in the study are measures of general intelligence, including verbal skills, math, and logic. "Processing speed plays a big part in how intelligent you are, but it's not the only factor," says Shaw.
The new study is among the first to link a specific neural architecture to IQ in healthy individuals. "Most people have focused on grey matter," says Shaw. "This is good evidence we should be looking at white matter as well." Previous studies using DTI have linked white matter damage to Alzheimer's disease, chronic alcoholism, and traumatic brain injury.
The UCLA researchers took the study a step further by comparing the white matter architecture of identical twins, who share almost all their DNA, and fraternal twins, who share only half. Results showed that the quality of the white matter is highly genetically determined, although the influence of genetics varies by brain area. According to the findings, about 85 percent of the variation in white matter in the parietal lobe, which is involved in mathematics, logic, and visual-spatial skills, can be attributed to genetics. But only about 45 percent of the variation in the temporal lobe, which plays a central role in learning and memory, appears to be inherited.
Thompson and his collaborators also analyzed the twins' DNA, and they are now looking for specific genetic variations that are linked to the quality of the brain's white matter. The researchers have already found a candidate--the gene for a protein called BDNF, which promotes cell growth. "People with one variation have more intact fibers," says Thompson.
The search for the genetic and neuroanatomical basis of intelligence has been controversial, largely because opponents fear it will spawn a deterministic view of abilities and education. "People worry that if something is genetic, they have no power to influence it," says Thompson. "But that's not true at all." For example, both an average runner and a genetically gifted one can benefit from training.
But the debate may be moot since, as Wedeen points out, it is unlikely that an individual brain scan could predict a person's IQ. "The report described aggregate data over number of individuals," he says. "That's not the same as saying we can do a scan and determine a person's intelligence. That may be in the offing, but we don't know that yet."
Copyright Technology Review 2009.
-----
Friday, March 20. 2009
So You Want To Be A Citizen Scientist
The National Phenology Network’s Project Budburst Facebook group; an unidentified insect posted by Flickr user urtica as part of a citizen science project Life on the Japanese Knotweed; pasque flowers spotted in Brainerd, MN, by Flickr user esagor.

Are you plugged in to the Internet? Are you an amateur hiker? Photographer? Gardener? Birdwatcher? Frog aficionado? Nature lover? If the answer to any of these questions is “yes,” then with the click of a button you can also make a serious contribution to the study of climate change.
Online social networking is no longer just about tagging a picture of your dog on Facebook or announcing to the world what you’re having for dinner on Twitter. Scientific institutions worldwide are beginning to harness the power of online social networking for scientific research. Online communities are an ideal vehicle for matching professional scientists with armies of enthusiastic amateurs. This corps of citizen scientists has the capacity to capture far more data over a vastly expanded geographical spectrum than professional scientists can on their own.
The USA National Phenology Network is one organization that is reaching out to citizen scientists via the Internet. People have used phenology, the study of the timing of lifecycle events of plants and animals, to detect the signs of spring since the early 18th century. The rising threat posed by global warming has spurred scientists to put phenology to another use: to detect the signs of climate change.
Plants and animals are very sensitive to even the smallest changes in their climates. Shifts in the timing of their lifecycle events can therefore be an important indicator in the study of climate change and its effects. Slight changes can have huge repercussions; mutual relationships between species and even entire systems can begin to fall apart.
USA-NPN is asking people across the country to record the phenology of their local flora and then report it online. Amateur hikers and photographers can also participate in NPN’s Project Budburst. They are asked to identify the phenological stage of the flowers and plants they see using information provided by the project’s website. The participants record the location, longitude, and latitude of what they observe. Eventually, Project Budburst will use this information to include real-time mapping with Google maps.
Relying on anonymous volunteers to collect data that will be entered into important scientific databases certainly raises questions about the reliability of the information gathered. Yet it turns out that most of the data is remarkably accurate, and researchers do perform checks on anomalous data. What’s more, the large pool of samples collected by a large group of volunteers diminishes the impact of any faulty data.
This creative new use for social networking also answers critics’ accusations about the frivolity of Facebook, Twitter, and other sites with proof that online networking has the potential to mobilize users to actively participate in innovative programs. Jack Weltzin, executive director of NPN, has said that in the future NPN hopes to make it possible for people to submit their findings via Twitter. NPN, a nonprofit organization, also hopes that iPhone and Facebook applications might be created to more easily facilitate volunteer participation.
Climate change scientists are not the only members of the scientific profession to tap into the potential of these online communities. In addition to tracking climate change, the information participants collect can help scientists predict wildfires and pollen production and monitor droughts as well as detect and control invasive species. Other online projects, such as “The Great World Wide Star Count,” rely on volunteer participation to gauge the level of light pollution across the globe. Several websites are also dedicated to tracking the migratory and breeding patterns of animals such as birds, frogs, and butterflies. All of these observations will augment the databases available to scientists attempting to understand annual fluctuations.
Imagine what the near future will bring–a world where you wake up, look out your window, and notice the first lilac blossom of spring. As you drink your coffee, you report your floral spotting on Twitter. Presto! You’ve made a contribution to the study of climate change before you’ve even had your eggs.
So the next time you head outside, grab your camera and snap a picture of the flowers that are starting to bloom in your neighbor’s yard. Then plot your location on your Google maps and give scientists the help they need to understand global warming and its consequences.
This piece originally appeared on Climate Progress.
This article is reprinted from the Center for American Progress’s “It’s Easy Being Green” series.
-----
Via Worldchanging
Personal comment:
Une utilisation intéressante du "crowdsourcing" et des réseaux sociaux.
Tuesday, March 17. 2009
Mapping a City's Rhythm
 |
||
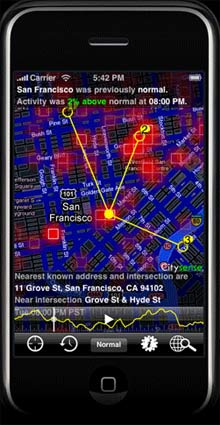
| Outside vibe: Citysense is a downloadable application for the iPhone and BlackBerry. It provides a heat map of GPS activity in a major city. Here, San Francisco is shown with red patches that indicate higher activity. The application has also identified the user’s location (a solid yellow dot) and suggests popular destinations (yellow circles). Credit: Sense Networks |
||
|
Multimedia
|

While this sort of behavior is common knowledge, it hasn't been visible to the average person. Sense Networks, a startup based in New York, is now trying to bring this side of a city to life. Using cell-phone and taxi GPS data, the startup's software produces a heat map that shows activity at hot spots across a city. Currently, the service, called Citysense, only works in San Francisco, but it will launch in New York in the next few months.
On Wednesday, at the O'Reilly Emerging Technologies conference in San Jose, CA, Tony Jebara, chief scientist for Sense Networks and a professor at Columbia University, detailed plans of a forthcoming update to Citysense that shows not only where people are gathering in real time, but where people with similar behavioral patterns--students, tourists, or businesspeople, for instance--are congregating. A user downloads Citysense to her phone to view the map and can choose whether or not to allow the application to track her own location.
The idea, says Jebara, is that a person could travel to a new city, launch Citysense on her phone, and instantly get a feel for which neighborhoods she might want to spend the evening visiting. This information could also help her filter restaurant or bar suggestions from online recommendation services like Yelp. Equally important, from the company's business perspective, advertisers would have a better idea of where and when to advertise to certain groups of people.
Citysense, which has access to four million GPS sensors, currently offers simple statistics about a city, says Jebara. It shows, for instance, whether the overall activity in the city is above or below normal (Sense Networks' GPS data indicates that activity in San Francisco is down 34 percent since October) or whether a particular part of town has more or less activity than usual. But the next version of the software, due out in a couple of months, will help users dig more deeply into this data. It will reveal the movement of people with certain behavior patterns.
"It's like Facebook, but without the self-reporting," Jebara says, meaning that a user doesn't need to actively update her profile. "We want an honest social network where you're connected to someone because you colocate."
In other words, if you live in San Francisco and go to Starbucks at 4 P.M. a couple of times a week, you probably have some similarities with someone in New York who also visits Starbucks at around the same time. Knowing where a person in New York goes to dinner on a Friday night could help a visitor to the city make a better restaurant choice, Jebara says.
As smart phones with GPS sensors become more popular, companies and researchers have clamored to make sense of all the data that this can reveal. Sense Networks is a part of a research trend known as reality mining, pioneered by Alex Pentland of MIT, who is a cofounder of Sense Networks. Another example of reality mining is a research project at Intel that uses cell phones to determine whether a person is the hub of a social network or at the periphery, based on her tone of voice and the amount of time she talks.
Jebara is aware that the idea of tracking people's movements makes some people uncomfortable, but he insists that the data used is stripped of all identifying information. In addition, anyone who uses Citysense must first agree to let the system log her position. A user can also, at any time, delete her data from the Sense Networks database, Jebara says.
Part of Sense Networks' business plan involves providing GPS data about city activity to advertisers, Jebara says. But again, this does not mean revealing an individual's whereabouts--just where certain types of people congregate and when. For instance, Sense Networks' data-analysis algorithms may show that a particular demographic heads to bars downtown between 6 and 9 P.M. on weekdays. Advertisers could then tailor ads on a billboard screen to that specific crowd.
So far, Jebara says, Sense Networks has categorized 20 types, or "tribes," of people in cities, including "young and edgy," "business traveler," "weekend mole," and "homebody." These tribes are determined using three types of data: a person's "flow," or movements around a city; publicly available data concerning the company addresses in a city; and demographic data collected by the U.S. Census Bureau. If a person spends the evening in a certain neighborhood, it's more likely that she lives in that neighborhood and shares some of its demographic traits.
By analyzing these types of data, engineers at Sense Networks can determine the probability that a user will visit a certain type of location, like a coffee shop, at any time. Within a couple of weeks, says Jebara, the matrix provides a reliable probability of the type of place--not the exact place or location--that a person will be at any given hour in a week. The probability is constantly updated, but in general, says Jebara, most people's behavior does not vary dramatically from day to day.
Sense Networks is exploring what GPS data can reveal about behavior, says Eric Paulos, a professor of computer science at Carnegie Mellon. "It's interesting to see things like this, [something] that was just research a few years ago, coming to the market," he adds. Paulos says it will be important to make sure that people are aware of what data is being used and how, but he predicts that more and more companies are going to find ways to make use of the digital bread crumbs we leave behind. "It's going to happen," he says.
Copyright Technology Review 2009.
-----
Related Links:
20 years of the first paper about the World Wide Web

Yesterday I attended “World Wide Web@20″ at CERN in Geneva where Web founders celebrated the 20 years of the “Original proposal for a global hypertext project at CERN” (1989). Tim Berners-Lee, Ben Segal, Jean-Francois Groff, Robert Cailliau and others gave a set of talks about the history and the future of the Web.
The afternoon was quite dense inside the CERN globe and I won’t summarize every talks. I only wanted to write down the set of insights I collected there.
First about the history:
- The main point of Berners-Lee was that “people just need to agree on a few simple things”, which was quite a challenged in the context of emergence of his invention: CERN. At the time, computers and IT in general was a zoo. There were many companies(OS), network standards were different (each company had at least one, CERN had its own… TCP/IP just began to appear form the research environment but were opposed by European PTTs and industry).
- What was interesting in the presentation was the context of CERN itself: computing was really one of the last important thing in terms of political order (after physics and accelerators). Desktops, clusters and networking were also perceived as less important as big mainframes. And of course, TCP/IP was considered “special” and illegal until 1989! To some extent, there was an intriguing paradox: the Web was created at CERN but from its weakest part and using “underground” resources
- The Web wasn’t understood at first. This paradigm shift was not understood, people did not get why they should put their data on this new database because they did not understand what it would lead to
The key invention was the url, something you can write on a piece of paper and give to people - Berners-Lee also pointed out the importance of the Lake Geneva area (”looking at the Mont Blanc this morning I realized how much you take it for granted when you live here”) and how the environment was fruitful and important in terms of diversity (researchers coming from all around the World).
- The basic set of things people should agree on was quite simple:
- URIs
- HTML was used for linking but it ended up being the documentation language of choice
- Universality was the rule and it worked, an important step was having CERN not charging royalties
- It was also interesting to see how the innovation per se was more about integrating ideas and technologies than starting something from scratch. As shown during the demo of the first webserver and by the comments on the first research papers about the Web, it was all a matter of hyperlinks, using an existing infrastructure (the internet), URI and of course the absence of royalties from CERN. People just needed to agree on a few simple things as TBL repeated.
The future part was very targeted at W3C thinking about the web future. As Berners-Lee mentioned “the Web is just the tip of the iceberg, new changes are gonna rock the boat even more, there are all kinds of things we’ve never imagined, we still have an agenda (as the W3C)”. The first point he mentioned was the importance for governments and public bodies to release public data on the web and let people have common initiative such as collaborative data (a la open street map). His second point here was about the complexity of the Web today:
“the web is now different from back then, it’s very large and complicated, big scale free system that emerged. You need a psychologist to know why people make links, there are different motivations
we need people who can study the use of the web. We call it Web Science, it’s not just science and engineering, the goal is to understand the web and the role of web engineering“

And eventually, the last part was about the Semantic Web, the main direction Tim Berners-Lee (he and the team of colleagues he invited in a panel) wanted to focus on for the end of the afternoon. From a foresight researchers standpoint, it was quite intriguing to see that the discussion about the future of the Web was, above all, about this direction. Berners-Lee repeated that the Semantic Web will happen eventually: “when you put an exponential graph on an axis, it can continue during a lot of time, depending on the scale… you never know the tipping point but it will happen“. The “Web of data” as they called it was in the plan from the start (”if you want to understand what will happen, go read the first documents, it’s not mystical tracks, it’s full of clever ideas“): we now have the link between documents and the link between documents and people or between people themselves is currently addressed. Following this, a series of presentation about different initiatives dealt with:
- grassroots effort to extent the web with data commons by publishing open license datasets as linked data
- the upcoming webpresence of specific items (BBC programs)
- machine-readable webpages about document
- machine-readable data about ourselves as what Google (social graph API), Yahoo, Russia (yandex) are doing: putting big database of these stuff once you have this, you can ask questions you did not have previously. FOAF is an attempt into this direction too.
The last part of the day was about the threats and limits:
- Threats are more at the infrastructure level (net neutrality)than the Web level, governments and institution which want to snoop, intercept the web traffic
- A challenge is to lower the barrier to develop, deploy and access services for those devices, which should also be accessible for low literacy rates, in local languages (most of which are not on the web).
- One of the aim is to help people finding content and services even in developing countries. It’s also a way to empower people.
- The dreamed endpoint would be the “move form a search engine to an answer engine : not docs but answers” and definitely not a Web “to fly through data in 3D“.
Why do I blog this? The whole afternoon was quite refreshing as it’s always curious to see a bunch of old friends explaining and arguing about the history of what they created. It somewhat reminded me how the beginning of the Web as really shaped by:
- a certain vision of collaboration (facilitating content sharing between researchers), which can be traced back to Vannevar Bush’s Memex, Ted Nelson’s Xanadu, the promises of the Arpanet/Internet in the 70s (Licklider).
- the importance of openness: one can compare the difference between the Web’s evolution and other systems (Nelson’s work or Gopher). What would have happened if we had a Gopher Web?
- a bunch of people interested in applying existing mechanisms such as hypertext, document formating techniques (mark up languages)
What is perhaps even more intriguing was that I felt to what extent how their vision of the future was still grounded and shaped by their early vision and by their aims. Their objective, as twenty years ago, is still to “help people finding content, documents and services”, the early utopia of Memex/Arpanet/Internet/Xanadu/the Web. The fact that most of the discussion revolved around the Semantic Web indicates how much of these three elements had an important weight for the future. Or, how the past frames the discussants’ vision of the future.
Curiously enough the discussion did not deal with the OTHER paths and usage the Web has taken. Of course they talked briefly about Web2.0 because this meme is a new instantiation of their early vision but they did not comment on other issues. An interesting symptom of this was their difficulty in going beyond the “access paradigm” as if the important thing was to allow “access”, “answers” and linkage between documents (or people). This is not necessarily a critique, it’s just that I was impressed by how their original ideas were so persistent that they still shape their vision of the future.
-----
Via Pasta & Vinegar (Nicolas Nova)
Personal comment:
Outre le passé du web (et cela reste toujours une histoire intéressante à entendre, comment les choses sont apparues, etc.), quelques pistes ici sur l'avenir possible de notre "grand réseau" avec lequel nous vivons désormais en symbiose et co-développement.
Wednesday, March 11. 2009
The Biggest Carbon Calculator: Measuring Emissions at the City Level
 Measuring our individual carbon footprint helps us see where our choices fit into the bigger picture. And, because various tools allow us to calculate our impacts at the individual level with relative accuracy, it's easy to discuss what they are and how to change them. But as we've noted before, hyper-focusing on individual responsibility in the face of climate change can be confusing … or worse.
Now, Microsoft is working on a new software tool with the goal of helping measure and understand the climate-changing impacts of entire cities. I first learned about the project in February, when business executives from a cross section of industries met in Chicago to discuss the urgency and potential economic advantages of corporate environmental responsibility. The mid-morning panel discussion deteriorated into bickering for a few moments, when one panelist reached for one of the plastic water bottles set out on the table. The chairman of Ikea’s GreenTech operations objected to the presence of plastic bottles at the event; Coca-Cola’s Senior VP of Technical Sustainability contended that the bottles weren’t necessarily problematic, contingent on a number of variables. The debate temporarily diverted attention from the panel topic, “The Sustainability Advantage: Who Will Survive and Why.”
Rob Bernard, Chief Environmental Strategist for Microsoft and one of the panelists at the discussion, believes this squabble represents a widespread problem in the dialogue about best sustainability practices.
“You can talk about how much post-consumer content is in the bottle, about whether it gets recycled. The answers are often so complicated it’s hard to know where to start. The problem,” Bernard says, “is that our debates are emotion-driven, not data-driven. How do you use software so that we can debate based on data instead of perception?”
In an effort to make these data sets both accessible and standardized at a scale beyond the individual, Microsoft is developing software to quantify extraordinarily large and complex environmental footprints. Partnering with the Clinton Foundation, the International Council for Local Environmental Initiatives, Ascentium Corporation and the Center for Neighborhood Technology in an initiative called Project 2˚, Microsoft is developing software to track GHG emissions generated by major cities. The free web-based application will be available to the C40—a summit of the world’s 40 largest cities—as a means of sharing information online and tracking the efficacy of current programs. The idea is to standardize the language describing metropolis-scale environmental impact and facilitate discussion about best practices.
The application is similar to another release from Microsoft called the Environmental Sustainability Dashboard, which allows businesses to track resource consumption and emissions by plugging in figures from past utility bills. Applied at the city scale, the software could be a valuable tool in assessing and deconstructing the impact of massive, complex systems, and could provide insight in drafting future climate initiatives.
Sharon Hoyer is a freelance writer covering sustainability, culture and arts in Chicago. You can find more of her writings on the environment at Centerstage Chicago. You can find her in the garden or on her bike.
-----
Via WorldChanging
Personal comment:
Alors on attend le "software" de Microsoft, en souhaitant qu'il fonctionnera mieux que ... :)
fabric | rblg
This blog is the survey website of fabric | ch - studio for architecture, interaction and research.
We curate and reblog articles, researches, writings, exhibitions and projects that we notice and find interesting during our everyday practice and readings.
Most articles concern the intertwined fields of architecture, territory, art, interaction design, thinking and science. From time to time, we also publish documentation about our own work and research, immersed among these related resources and inspirations.
This website is used by fabric | ch as archive, references and resources. It is shared with all those interested in the same topics as we are, in the hope that they will also find valuable references and content in it.
