Monday, June 07. 2010
The Geotaggers World Atlas by Eric Fischer

The maps are ordered by the number of pictures taken in the central cluster of each one. This is a little unfair to aggressively polycentric cities like Tokyo and Los Angeles, which probably get lower placement than they really deserve because there are gaps where no one took any pictures. The central cluster of each map is not necessarily in the center of each image, because the image bounds are chosen to include as many geotagged locations as possible near the central cluster. All the maps are to the same scale, chosen to be just large enough for the central New York cluster to fit. The photo locations come from the public Flickr and Picasa search APIs. See them all here.
Related Links:
Personal comment:
This is nothing new as a practice (to build up maps based on the analysis or mining online data --pictures in this case--), but the maps are beautiful and of course revealing when it comes to tourists or popular locations in cities!
Bing Destination Map: Automatic Napkin Sketching of Maps
-----
When you ignore some of the UI elements, the sometimes prolonged waiting time, and the occasional crashes, Bing Destination Maps [bing.com] seems quite interesting as a new way of rendering geographical maps in a more visually simplified, understandable and accessible way. In other words, imagine one can now create a sort of information-optimized summary maps, similar to those you would quickly draw yourself on the back of napkin.
Users are able to specify a specific location, set the area of interest by dragging the sides of the on-map square, and provide the map with a title. The 'cool' feature allows the selection of a visual map style such as 'Sketchy', 'European', 'American' or 'Treasure' (think about the favorite activity of pirates).
If you have no time to wait for rendering process, have a look at some example maps below.
Personal comment:
This is a quite funny feature that MS has implemented on Bing. But further than this, I would be interested to know the algorithm behind it, as a sketch (or napkin) map is closer to a mind map, where only the strong or easy to remember elements remain.
Tuesday, December 08. 2009
Put on Your Google Goggles and Visually Search the World
 Google’s breaking news left and right today. Of course the big news is that real-time search is live, but the release of Google Goggles can’t be overlooked. The brand-new addition to Google Labs is an experimental application for Android devices that supports visual search.
How does it work? Just open the app, snap a photo and voilà: Google will process the image and return search results. The photo search functionality eliminates the need to type or say anything on your mobile device, and it adds context to your real-world surroundings.
While the technology is pretty remarkable, Google admits that it is still in its infancy. So while some image searches work brilliantly — think photos of books, business cards, artwork, places, logos and landmarks — don’t be too disappointed if your image searches for food, animals, plants and cars are less than stellar.
Still, the application should prove useful, and we hope to see versions of it made available for other smartphone users as well. For now, though, iPhone users can turn to a number of different augmented reality applications for camera-enabled search functionality.
Watch the video below for a demonstration of Google Goggles.
-----
Via Mashable
Related Links:
Personal comment:
More about Google today: yet another example of Google starting to mix real and virtual worlds and mediatization to space a bit further. What they call Google Goggles.
Why Googles Slapping Decals on Small Businesses
 QR codes are those funky-looking barcodes that you’ll sometimes spot on print marketing materials or even pedicabs. While QR codes do offer you a unique way to use your mobile phone camera to capture/scan the code to retrieve a message, they haven’t been embraced by the mainstream population. But can Google change that?
In an effort to beef up attention for their Place Pages project within Google Maps, which is in direct competition with Yelp, Google has started an online and offline program. The new initiative is centered around putting decals with QR codes in store windows, designed to draw your attention to the Favorite Places in your neighborhood.
Google is sending window decals to more than 100,000 U.S. businesses that they’ve identified as the most sought-after on Google and Google Maps. Much like the Yelp stickers you’re accustomed to seeing in businesses around town, these decals will appear in store windows and highlight the business’ status as a Google Favorite Place.
The decals also include prominent QR codes that you can scan with your mobile device to pull up the locale’s place page and get reviews — and possibly even coupons — for a particular establishment. At some future date, you’ll also be add a review from your phone (you can already draft a review using Yelp’s mobile app).
The problem with QR codes is that they require your mobile device to have an app that can scan the codes. iPhone owners and Android users are covered, (Google has made the iPhone app QuickMark free for a limited time), but QR codes are still a fuzzy concept for most consumers. Plus, the decal maneuver is clearly part of a catch-up scheme to usurp Yelp’s stronghold over consumer reviews. Whether or not it will be effective remains to be seen.
Watch the video below to see the decals in action:
-----
Via Mashable
Personal comment:
QR codes are nothing really new. Just interesting to see Google starting to map it's results in the "real world" and provide businesses with stickers to connect mobiles users to their search engine while in the streets (and of course, everybody is happy! it's a publicity in the end right?).
But watch out, it's a strong actor that enter this field of "mapping" the digital world into the physical one (and vice versa of course!)
Tuesday, August 04. 2009
Map of Buried City Altinum - See it in Google Earth
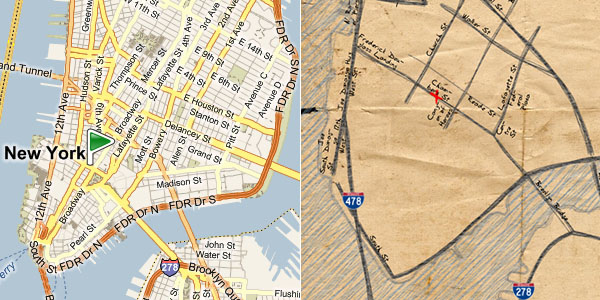
Late last week I read about a scientific paper scheduled for publication which documented the findings of research on the ancient city of Altinum in Italy (near Venice). The city used to be a thriving Roman City until it was sacked multiple times because of its exposed location. The remains of Altinum have been buried in some fields north of the Venice airport. Rather than try to dig up the site, scientists jhave used satellite and aerial photography to map the locations of the buildings and roads of the city.
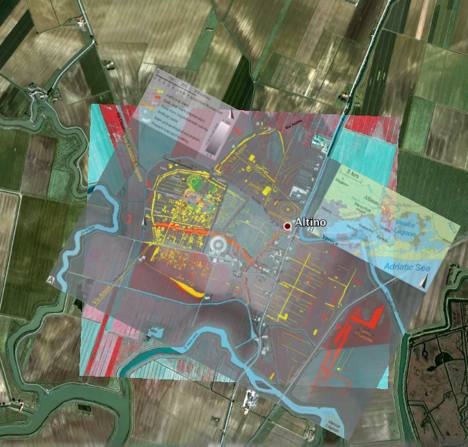
Since a brief description of the location and an aerial photo was published, I immediately went searching for the site in Google Earth. Unfortunately, I didn't find it right away, so I did a quick search and found the location had been shared at the GEC by 'jean_thie', and an overlay of the map  was made available in the post.
Stefan Geens of OgleEarth.com has published an excellent GE overview of the Altinum findings and includes great tips on using Google Earth (and the historical imagery mode) to delve even further into this interesting archaeological site. Stefan also found more of the researchers material and has overlayed several of their maps in this KML file . I highly recommend reading Stefan's post.
-----
Personal comment:
D'un blog à l'autre... Clin d'oeil en rapport au post ci-dessous.
Tuesday, July 21. 2009
Take a Virtual Trip to the Moon With Google Earth
 Coinciding with the 40th anniversary of the first Moon landing, Google has introduced a new feature in Google Earth, adding Earth’s most faithful follower to the popular geo application.
Google has been diligently adding data to Google Earth, expanding the geo-centric app to cover the sky, the ocean’s depths and the Red Planet. You can now explore the Moon from the same icon in the top toolbar that holds Sky, Mars and Earth. Fire it up, and you can explore lunar imagery, historical data, images and videos from the Apollo missions, panoramic images of the moon, 3D models of lunar modules and more.
Check out a brief introduction to this new feature in the video below. You can download the latest version of Google Earth 5.0 here.
-----
Via Mashable
Tuesday, June 02. 2009
Rodsbot, étonnant Google Earth
par Astrid Girardeau
Rainbow error
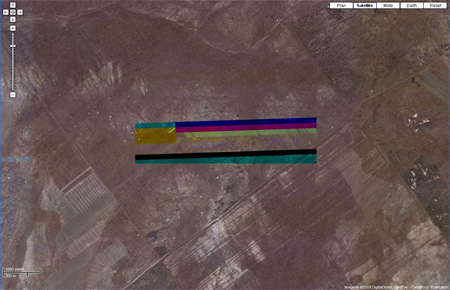
Ce n’est pas le premier site du genre, mais le genre de site qui accroche toujours, comme la première fois. Rodsbot répertorie, par thématique, les vues étranges trouvables dans Google Earth, le logiciel de cartographie 3D de Google.
Créé par Stéphane Clérice, du site Geotrotter dont il est une sorte d’annexe, Rodsbot affiche ainsi quelque 1139 vues étonnantes, drôles, voire effrayantes. Autour de thèmes très variés, des réalisations humaines (Human Made et Art)aux inévitables UFO. Voir aussi Look Like, Landscape, et Message. Sans oublier les loupés et zones censurées d’Error.
Loin des belles images (d’un certain Yann A-B par exemple), l’intérêt est ici l’aspect tangible (parfois éphémère) des prises. En cliquant sur une photographie on arrive dans l’interface de Google Earth. De là on peut s’approcher, s’éloigner, passer en mode carte ou relief, et se promener dans les alentours.
 Painting palette
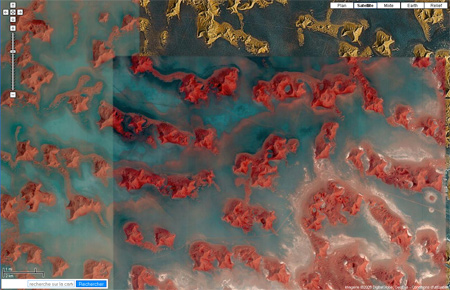 Red and blue
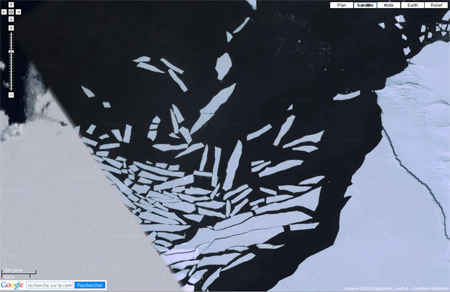 > Ice pick
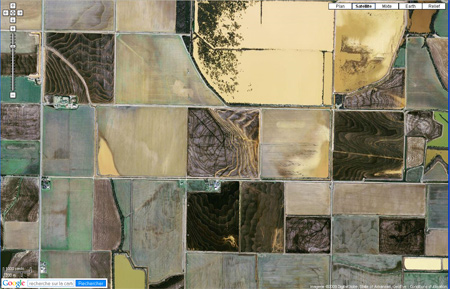 Simply art patern
-----
Via Libération
Related Links:
Wednesday, May 27. 2009
Obama One People: Revealing the Emotional Flow of the Presidential Inauguration
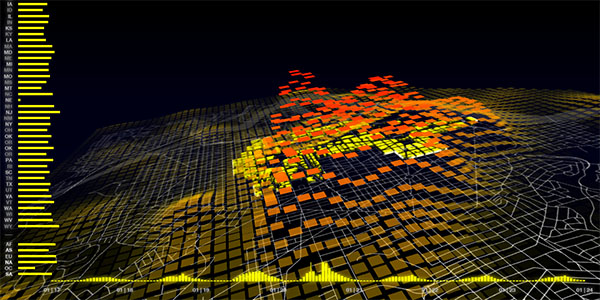
Obama | One People [senseable.mit.edu] consists of two "dazzling" visualizations that celebrate Barack Obama and the people who supported him from all over the U.S. and the world. The maps are based on mobile phone call activity that characterize the inaugural crowd and answer the questions: "Who was in Washington, D.C. for President Obama's Inauguration Day?" and "When did they arrive, where did they go, and how long did they stay?"
The data analyzed consists of hourly counts of mobile phone calls served in Washington, D.C. and includes the origin of the phones involved in the calls. The map of Washington, D.C. is overlaid with a 3D color-coded animated surface of square tiles (1 tile represents an area of 150 x 150 meters). Each tile rises and turns red as call activity increases and likewise drops and turns yellow as activity decreases. On the left, a bar chart breaks down the call activity by showing the normalized contributions of calls from the 50 states and 138 foreign countries grouped by continent. The timeline at the bottom illustrates the overall trend of call activity in the city during the week of the Presidential Inauguration.
"Examining the relative increase in call activity by state reveals some unexpected results. The states with the strongest increase were the southern states of Alabama, Georgia, Kentucky and Tennessee, with calls up to twelve times the normal levels. These are states that played a prominent role in the Civil Rights movement and notably are also so-called red states whose voting population went for the Republican candidate, John McCain. Other states with a ten-fold increase in call activity were Illinois, Barack Obama's home state, and Michigan, Ohio and Indiana, swing states which went blue, voting for President Obama. Most interestingly, comparing these results with U.S. demographic statistics shows that the percentage of African Americans in each U.S. state is a predominant factor determining increase in call activity and therefore participation in the event, which instead was not necessarily influenced by the state's proximity to Washington, D.C. or its political leaning." Other data analysis findings are described here.
Watch the three accompanying movies below.
See also World's Eyes: Mapping the Visual Traces of Tourism in Spain, Senseable City of New York, Real Time Rome and Mobile Phone Landscape Graz. Via datavisualization.ch.
-----
Personal comment:
Une cartographie "d'activité" de la ville (utilisation de téléphones portables lors du discours d'inauguration de B. Obama) qui révèle des "patterns" à priori invisibles. Ce type de visualisation de données extraites de la ville, développant de nouvelles cartes, une sorte d'"algorythmique du réel" (reality computation) va se développer de plus en plus, sur tout type de données.
Tuesday, May 26. 2009
Memorial Day - Map the Fallen in Google Earth
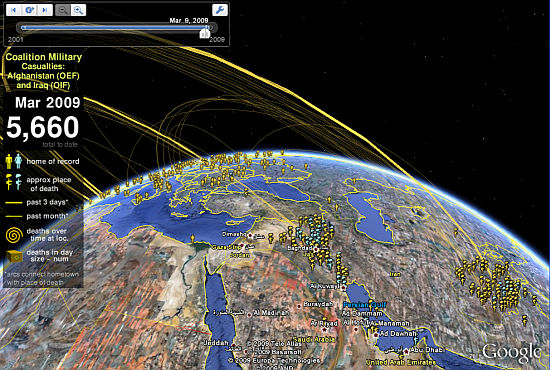
Back in November of 2005, a Google Earth Community member posted the first version of a map showing US and Coalition soldiers who made the ultimate sacrifice in the Iraq and Afghanistan conflicts. He worked with other members of the Google Earth Community to refine the map over time - and worked hard to focus on just providing a memorial to these fallen soldiers - not provide a political statement about the war. Since 2005, Sean Askay worked on his master's thesis involving Google Earth and sensor networks to monitor a protected wilderness, and after landing a job at Google, has been working for the Google Earth Outreach team helping organizations create content to make people aware of environmental and human issues around the world.
Meanwhile, using his 20% time at Google, Sean continued to refine the casualties map, and his knowledge of KML has also advanced. He has produced one of the most sophisticated, yet elegant, and very informative KML files I've seen to date (and I've seen a lot of KML in the last 4 years!). View the map here  (Google Earth 5 required) which appears on his Map the Fallen blog. According to Google (which posted this on their Lat Long Blog):
Sean uses over 24,000 placemarks, 6,000 folders, 2,500 screen overlays, and line arcs with over 250,000 vertices, all to create an immersive and compelling user experience. By making extensive use of Google Earth 5.0's new features, including iframes, CSS and JavaScript support in balloons and time-based navigation, you can now fly to a place and time. With a blend of navigation methods, people can look up information about servicemen and women alphabetically, by age, location or chronology.
You should read what Sean himself says about the collection. Sean worked with GEC moderator Warrant Officer Frank McVey, a retired member of the UK's Royal Air Force, who worked many hours to help with the collection.
-----
Personal comment:
Un projet un peu morbide je l'admets, cartographier les morts des guerres en Irak et Afganistan... D'où ils venaient, où ils sont morts. Et ça commence à faire bcp de morts... Etonnant de voir aussi les informations qu'on peut en tirer: d'où viennent majoritairement les soldats et quelles sont les zones à éviter... Bizarre projet de "mapping".
Ce serait "intéressant" (et certainement instructif) d'avoir l'équivalent irakien ou afghan... Combien? 50, 100 x plus de morts?
fabric | rblg
This blog is the survey website of fabric | ch - studio for architecture, interaction and research.
We curate and reblog articles, researches, writings, exhibitions and projects that we notice and find interesting during our everyday practice and readings.
Most articles concern the intertwined fields of architecture, territory, art, interaction design, thinking and science. From time to time, we also publish documentation about our own work and research, immersed among these related resources and inspirations.
This website is used by fabric | ch as archive, references and resources. It is shared with all those interested in the same topics as we are, in the hope that they will also find valuable references and content in it.
Quicksearch
Categories
Calendar
|
|
April '24 | |||||
| Mon | Tue | Wed | Thu | Fri | Sat | Sun |
| 1 | 2 | 3 | 4 | 5 | 6 | 7 |
| 8 | 9 | 10 | 11 | 12 | 13 | 14 |
| 15 | 16 | 17 | 18 | 19 | 20 | 21 |
| 22 | 23 | 24 | 25 | 26 | 27 | 28 |
| 29 | 30 | |||||
