Editor's note: We just received a tip from Joseph Nechvatal about his new book project which looks quite promising. Note the details of the summary below and—best of all—the text is open-access.
The noise factor is the ratio of signal to noise of an input signal to that of the output signal. Noise can block or interfere with the meaning of a message in both human and electronic communication. But in Information Theory, noise is still considered to be information.
By refining the definition of noise as that which addresses us outside of our preferred comfort zone, Joseph Nechvatal's Immersion Into Noise investigates multiple aspects of cultural noise by applying the audio understanding of noise to the visual, architectural and cognitive domains. Nechvatal expands and extends our understanding of the function of cultural noise by taking the reader through the immersive and phenomenal aspects of noise into algorithmic and network contexts, beginning with his experience in the Abside of the Grotte de Lascaux.
Immersion Into Noise is intended as a conceptual handbook useful for the development of a personal-political-visionary art of noise. On a planet that is increasingly technologically linked and globally mediated, how might noises break and re-connect in distinctive and productive ways within practices located in the world of art and thought? That is the question Joseph Nechvatal explores in Immersion Into Noise.
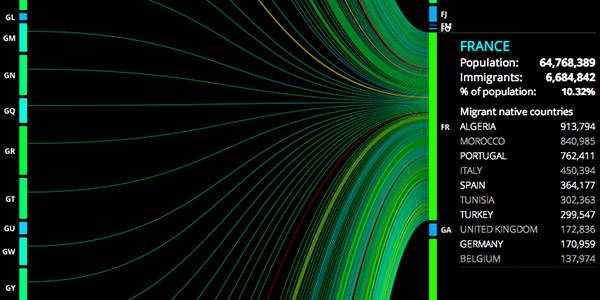
About 3% of the world's population does not live in their native countries, including those that can be classified as refugees or asylum seekers. People Movin [peoplemov.in] by Carlo Zapponi is a simple but oh-so-beautiful and still effective interactive graph that highlights all these migration patterns in the world as of the year 2010 in one single view.
Based on open datasets from the World Bank and the U.S. Census Beurau Bureau, the migration data is represented as one, large flow chart that connects the origin countries (left) with the destination countries (right). The relative thickness of each line represents the amount of immigrated people. Countries can be selected in the 2 columns, or in the small windows that pop up to provide more detailed information.
Well, there is that plus the website is actually also the result of developing a flow chart visualization framework based on HTML5 technologies.
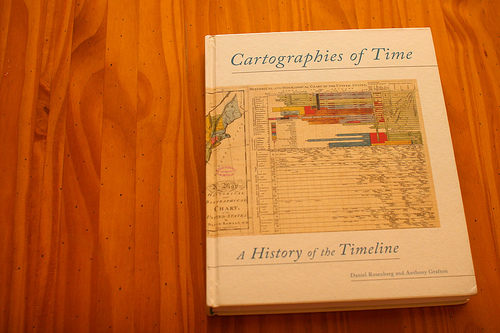
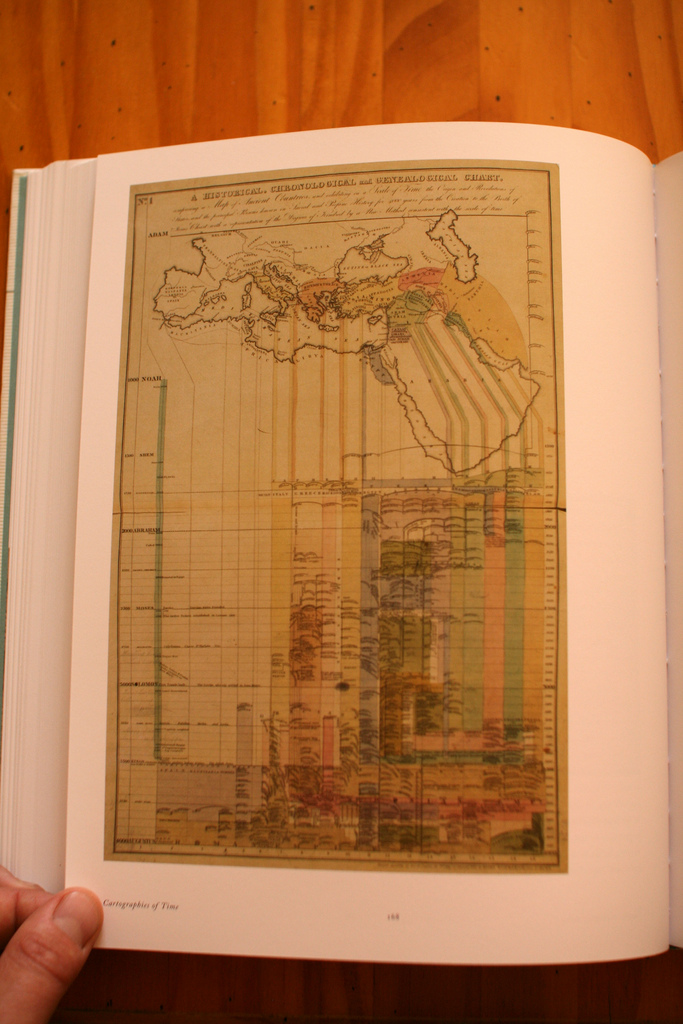
Working on the game controller book lately, I became fascinated by visual representations of time: evolutionary trees, time-series, timelines, etc. A great resource about this is certainly “Cartographies of Time: a history of the timeline” by Daniel Rosenberg and Anthony Grafton.
The book is a comprehensive history of graphic representations of time in Europe and the United States from 1450 to the present:
“ From medieval manuscripts to websites, Cartographies of Time features a wide variety of timelines that in their own unique ways–curving, crossing, branching–defy conventional thinking about the form. A fifty-four-foot-long timeline from 1753 is mounted on a scroll and encased in a protective box. Another timeline uses the different parts of the human body to show the genealogies of Jesus Christ and the rulers of Saxony. Ladders created by missionaries in eighteenth-century Oregon illustrate Bible stories in a vertical format to convert Native Americans. Also included is the April 1912 Marconi North Atlantic Communication chart, which tracked ships, including the Titanic, at points in time rather than by their geographic location, alongside little-known works by famous figures, including a historical chronology by the mapmaker Gerardus Mercator and a chronological board game patented by Mark Twain.“
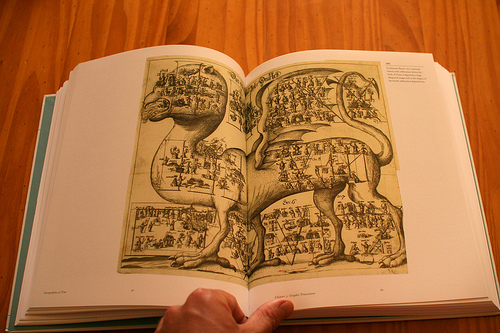
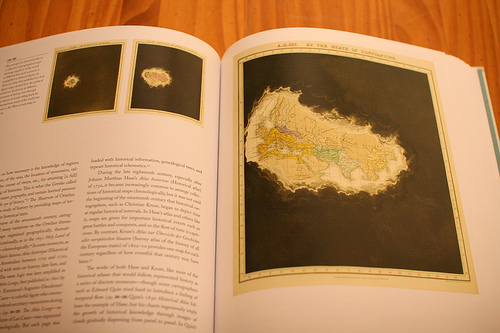
There’s also this gem at the end of the book, a sort of “Fog of war” representation:
Why do I blog this? Beyond the use of these as models to try different representations of game controller evolutionary trees, I am fascinated by the ways these timelines also add interesting spatial components on top of time-related visualizations.
This year, MIT is celebrating its 150th anniversary—and as part of the birthday festivities, I somehow got roped into creating a timeline of “150 major events in computer science history” (i.e., in the world, not MIT). I understand that the timeline will go up on a wall somewhere.
My first thought was that singling out the “most important events in CS history” was an exercise in futility, and not a particularly original one either. But then, as I spent weekends reading about Konrad Zuse, the UNIVAC, and the IBM 360, I started really getting into my assigned exercise in futility. Sure, there were great CS timelines already on the web—some of which I stole from shamelessly—but none of them had exactly the focus I was looking for. For example, the founding of a company didn’t strike me as a milestone in itself: the question was, what qualitatively new things did the company do? So I decided to take as a starting point the words and concepts that populate the mental landscape of CS: floating-point, compiler, graphics, network, bug. Which events were decisive in loosing these concepts upon the Earth? To clarify, I was just as interested in the demonstration, popularization, and commercialization of existing concepts as in the discovery of new ones: the release of Windows in 1985 brought few new ideas into the world, but it seems hard to argue that Windows hasn’t carved out its place on the mental map. But so, in my opinion, has the Time Hierarchy Theorem, even if only 0.01% as many people have heard of it.
I’m including my current draft list of 152 events below, so that Shtetl-Optimized readers can critique it, nitpick it, and tell me all about the important events I’ve left out and the events I’ve included that shouldn’t be there. I’ll carefully consider all of your suggestions, and will implement the ones that I like.
While you’re sharpening your nitpick-knives, though, let me explain the ground rules I decided to follow:
I adopted a strict policy against listing general trends (“word processing gains widespread acceptance”). To earn inclusion in the list, an event had to be something that happened at a particular time: for example, the release of a product, the publication of a book, or the beginning of a project. Of course, I often chose a specific event to illustrate a trend.
I also adopted a strict policy against arbitrary numerical milestones (“millionth website,” “first processor to break the 1GHz barrier”), since otherwise such milestones would proliferate endlessly.
Even though this was a list of events, I cared a great deal about representing people who played major roles in CS. When—as often happened—the same person was involved in too many significant events to list, I wasn’t shy about picking one or two events to highlight the person.
I wasn’t interested in external “recognition” bestowed on computers, such as TIME Magazine naming the computer its 1982 “Machine of the Year.” Nor was I interested in what you might call “internal housekeeping milestones”: the founding of the ACM or the first CS departments, the establishment of the Turing Award, etc. I felt that, if we’re going to engage in self-congratulation, then at least let it not be self-congratulation over self-congratulation!
Before we get to the list itself, let me give you a breakdown of number of milestones per time period:
From the data, it would appear that the level of intellectual excitement in computer science peaked in the 1960s, and has steadily declined ever since, except for a bump in the 1990s coinciding with the Internet boom. The past decade has been a particularly arid one, producing little of note besides Facebook, Wikipedia, YouTube, and the iPhone. If you don’t like that message—and I’m guessing that many of the MIT150 organizers won’t—then hey, don’t shoot the messenger! The biased, misleading, and unscientific data is what it is.
Without further ado:
300BC Euclid’s Elements describes nontrivial algorithms (for problems such as Greatest Common Divisor) that are still used today 150-100BC The Antikythera mechanism, an astronomical computer, is built in ancient Greece 825 Abu Abdallah Muhammad ibn Musa al-Khwarizmi writes “On the Calculation with Hindu Numerals,” the work primarily responsible for spreading decimal notation in the West. The word “algorithm” will be named for al-Khwarizmi 1622 William Oughtred invents the slide rule, which will remain in use until the 1970s 1642 Blaise Pascal builds an addition and subtraction machine 1669 Isaac Newton describes Newton’s method, an early numerical algorithm for finding roots of equations 1679 Gottfried Wilhelm Leibniz develops binary notation; Leibniz’s writings about a “Calculus Ratiocinator” are among the first to envision a general-purpose computer 1737 Jacques de Vaucanson builds a mechanical duck able to flap its wings, eat grain, and “defecate” 1770 Wolfgang von Kempelen unveils the Mechanical Turk, a “chess-playing automaton” secretly operated by a human. The hoax is only revealed 50 years later 1801 In his “Disquisitiones Arithmeticae,” Carl Friedrich Gauss discusses the computational complexity of factoring and primality testing 1837 Charles Babbage first describes plans for the Analytical Engine 1842 In her notes on the Analytical Engine, Ada Lovelace writes what’s generally considered the first computer program, to calculate Bernoulli numbers 1847 George Boole proposes Boolean logic 1869 William Stanley Jevons recasts Boole’s ideas in algebraic terms, and builds a wooden “logic piano” to construct the truth tables of small Boolean formulas 1879 Gottlob Frege publishes his “Begriffsschrift,” introducing first-order logic as a mathematically-precise language of thought 1890 Herman Hollerith builds the first electromechanical counting machine; the US government buys it to complete the census 1900 In a lecture to the International Congress of Mathematicians, David Hilbert asks for way to mechanize all of mathematical reasoning 1921 Czech author Karel Capek popularizes the term ‘robot’ in his play “R.U.R. (Rossum’s Universal Robots)” 1925 Vannevar Bush and colleagues create the first large-scale analog calculator at MIT 1931 Kurt Gödel publishes his Incompleteness Theorem; the system of “Gödel numbering” used in the proof foreshadows computer programming 1936 Alan Turing publishes “On computable numbers,” often considered the founding document of computer science; the paper gives an explicit construction of a universal Turing machine. Alonzo Church and Emil Post arrive at similar ideas independently 1936 Working alone in Germany, Konrad Zuse builds the Z1, the first working stored-program computer 1937 In his MIT master’s thesis—considered possibly the most influential master’s thesis in history—Claude Shannon proposes the application of Boolean algebra to electrical circuit design 1940 Building on earlier breakthroughs by Polish mathematician Marian Rejewski, Alan Turing builds an improved “Bombe” at Bletchley Park, to break the German Enigma code and help the Allies win WWII 1942 Isaac Asimov introduces his Three Laws of Robotics 1942 At Iowa State College, John Atanasoff and Clifford Berry successfully test a special-purpose vaccum-tube computer able to solve up to 29 simultaneous linear equations; Atanasoff will later spend decades in legal disputes to establish his computer’s priority over Eckert and Mauchly’s ENIAC 1943 Colossus, the world’s first programmable electronic computer, begins operation at Bletchley Park 1943 During the Manhattan Project, Richard Feynman and others pioneer large-scale scientific computing, using humans and later mechanical calculators 1943 In their paper “A Logical Calculus Immanent in Nervous Activity,” Warren McCulloch and Walter Pitts propose neural networks and finite automata 1944 The Mark I, designed by Howard Aiken, begins operations at Harvard 1945 In a 100-page “draft report on the EDVAC”, John von Neumann describes the architecture of a stored-program computer (henceforth called “von Neumann architecture”) 1945 Vannevar Bush publishes “As We May Think” in the Atlantic Monthly, a now-famous article that foresees a global information network based on hypertext 1946 At the University of Pennsylvania, J. Presper Eckert and John Mauchly complete the ENIAC 1946 In Los Alamos, Stanislaw Ulam develops the Monte Carlo method to speed up calculations of neutron diffusion in nuclear weapons 1947 At Bell Labs, John Bardeen, Walter Brattain, and William Shockley invent the transistor 1947 Operators of the Mark II computer trace an error to a moth trapped in a relay. The incident, popularized by Grace Murray Hopper, stimulates wider adoption of the terms “bug” and “debugging” 1947 George Dantzig proposes the simplex algorithm for linear programming 1948 In his landmark paper “A Mathematical Theory of Communication,” Claude Shannon first uses the word “bit,” attributing it to John Tukey 1948 Norbert Wiener publishes “Cybernetics: Or Control and Communication in the Animal and the Machine” 1949 The EDSAC, built by Maurice Wilkes, begins operations at Cambridge University 1949 Claude Shannon initiates the rigorous mathematical study of cryptography, publishing his proof that the one-time pad is unbreakable and that any unbreakable encryption system has the same basic properties 1950 Alan Turing proposes the Turing Test for artificial intelligence; four years later, Turing will commit suicide after being prosecuted for homosexuality 1950 CSIRAC, in Australia, becomes the first computer to play music 1951 J. Presper Eckert and John Mauchly release UNIVAC I, the first commercial electronic computer 1951 Grace Murray Hopper creates A-O, considered the first compiler 1951 MIT’s Whirlwind I computer goes online. Designed by Jay Forrester, Whirlwind features magnetic core memory and vacuum tubes that last 1000 times longer than those previously available 1952 Based on analysis of early returns, a UNIVAC computer borrowed by CBS News predicts that Dwight Eisenhower will defeat Adlai Stevenson in the presidential election 1954 Researchers at Birkbeck College perform the first demonstration of machine translation, with a rudimentary translation of English into French 1955 MIT’s Whirlwind I becomes the first computer to display graphics on a video console 1956 Dartmouth hosts the first conference on artificial intelligence, bringing the term AI into use 1956 In a letter to John von Neumann, Kurt Gödel first poses what will later become known as the P versus NP problem 1956 Edsger Dijkstra conceives his shortest-path algorithm, the basis for modern trip-planning software (Dijkstra also may have been the first person to list his profession as “programmer”) 1956 Noam Chomsky proposes the Chomsky Hierarchy, linking the theory of computing to formal languages 1956 MIT Lincoln Laboratories builds the TX-0, the first general-purpose computer to be built with transistors 1956 Reynold Johnson at IBM introduces the hard drive 1957 A team led by John Backus at IBM delivers a compiler for FORTRAN, the first high-level programming language 1958 John McCarthy proposes the LISP family of functional programming languages 1958 As part of the air-defense project SAGE, MIT Lincoln Labs links hundreds of radar stations in the first large-scale computer network 1958 Jack St. Kilby at Texas Instruments and Robert Noyce at Fairchild Semiconductor propose the integrated circuit 1959 In the seminal paper “Finite Automata and Their Decision Problems,” Dana Scott and Michael Rabin introduce the concept of nondeterminism into computer science 1960 Tony Hoare invents the Quicksort algorithm, while a visiting student at Moscow State University 1960 Irving Reed and Gustave Solomon give a systematic construction of error-correcting codes; later, Elwyn Berlekamp and James Massey will discover an efficient decoding procedure 1960 Ray Solomonoff proposes measuring the complexity of a string by the length of the shortest program that generates it; Andrey Kolmogorov and Gregory Chaitin will later arrive at similar ideas independently 1961 UNIMATE, the first industrial robot, begins work at General Motors 1961 A team led by MIT professor Fernando Corbato demonstrates the first computer time-sharing system 1961 A team led by MIT student Steve Russell creates Spacewar!, the first computer game 1962 While studying computer models of the weather, MIT professor Edward Lorentz discovers the phenomena that would later be popularized as “chaos theory” 1963 At MIT, Joseph Weizenbaum develops ELIZA, the now-famous program that simulates conversation between a Rogerian psychotherapist and a patient 1963 MIT graduate student Ivan Sutherland develops Sketchpad, the first Computer-Aided Design (CAD) software 1963 The first edition of ASCII (American Standard Code for Information Interchange) is published 1964 IBM releases the System/360, one of the first computers based on integrated circuits. Fred Brooks, the lead developer, later describes the lessons learned in his book “The Mythical Man-Month” 1964 At Dartmouth, John Kemeny and Thomas Kurtz create the BASIC programming language 1964 Seymour Cray releases the CDC 6600, the first of many record-breaking supercomputers 1964 American Airlines and IBM debut SABRE, the first computer-based travel reservation system 1965 AT&T debuts 1ESS, the first electronic telephone switching system, in Succasunna, New Jersey 1965 Intel cofounder Gordon Moore enunciates Moore’s Law, that the number of transistors per integrated circuit doubles roughly every two years 1965 At IBM, James Cooley and John Tukey rediscover and popularize the Fast Fourier Transform (versions of which were known to Gauss and others) 1965 Juris Hartmanis and Richard Stearns prove the existence of an infinite hierarchy of harder and harder computational problems 1965 MIT student Richard Greenblatt begins developing Mac Hack, the first computer chess program to succeed in tournament play. Mac Hack also defeats the AI skeptic Hubert Dreyfus, who had famously claimed that computers would never play high-quality chess 1965 Edsger Dijkstra introduces semaphores, which allow multiple concurrently-running programs to share the same resource 1966 Texas Instruments unveils the first electronic handheld calculator 1966 The first cash-dispensing ATM is installed in Tokyo 1967 At SRI, Douglas Engelbart and Bill English apply for a patent for the first computer mouse 1967 Andrew Viterbi invents the Viterbi algorithm for maximum-likelihood estimation in Hidden Markov Models; the algorithm will find major applications in speech recognition, bioinformatics, and both the CDMA and GSM cellular-phone standards 1967 In Norway, Ole-Johan Dahl and Kristen Nygaard develop Simula 67, considered the first object-oriented programming language and a major influence on Smalltalk and later C++ 1968 Donald Knuth publishes Volume 1 of “The Art of Computer Programming” 1968 Edsger Dijkstra publishes his now-famous article “Go To Statement Considered Harmful,” igniting an acrimonious debate about programming practices 1968 The movie “2001: A Space Odyssey” introduces the world to HAL 1968 Work begins at MIT on Macsyma, the first computer algebra system 1969 Victor Scheinman builds the Stanford Arm, the first electronic computer-controlled robotic arm 1969 ARPAnet, the precursor of the Internet, links UCLA, SRI, Santa Barbara, and Utah (MIT joins in 1970) 1969 At Bell Labs, Ken Thompson and Dennis Ritchie create UNIX, and begin developing the C programming language 1969 Arthur Bryson and Yu-Chi Ho introduce back-propagation, a learning technique for neural networks that is largely ignored until the 1980s. Meanwhile, Marvin Minsky and Seymour Papert publish “Perceptrons,” a book that introduces important mathematical techniques into computer science, but has also been accused of “killing” neural-net research for more than a decade 1969 The Apollo Guidance Computer plays a crucial role in steering Neil Armstrong and Buzz Aldrin to the lunar surface 1970 John Horton Conway invents the Game of Life cellular automaton; it is estimated that millions of dollars of computer time are wasted watching Lifeforms evolve 1970 E. F. Codd proposes the relational database management system (RDBMS) 1970 Yuri Matiyasevich, building on work of Julia Robinson, Martin Davis, and Hilary Putnam, shows the nonexistence of an algorithm to solve Diophantine equations, negatively resolving Hilbert’s Tenth Problem and demonstrating Turing-universality in one of the oldest parts of mathematics 1971 Stephen Cook and Leonid Levin independently prove that the Satisfiability problem is NP-complete; a paper by Richard Karp a year later demonstrates the pervasiveness of the NP-completeness phenomenon 1971 IBM commercially releases the floppy disk 1971 Ray Tomlinson sends the first email message on ARPANET 1971 Bob Thomas at BBN Technologies creates the first experimental computer virus 1972 Atari releases Pong 1973 At Xerox PARC, Alan Kay and collaborators create the Alto, featuring the first graphical user interface (GUI) with windows, icons, and menus 1973 Robert Metcalfe at Xerox PARC creates Ethernet 1974 MIT professor Barbara Liskov and students begin work on CLU, a predecessor of modern object-oriented programming languages 1976 Kenneth Appel and Wolfgang Haken prove the Four-Color Map Theorem, the first major theorem to be proved using a computer 1975 Bill Gates and Paul Allen adapt BASIC to the MITS Altair microcomputer 1975 Inspired by work of Ralph Merkle, Stanford researchers Whitfield Diffie and Martin Hellman announce the first protocol for public key exchange (which had been discovered previously at the British GCHQ, but kept classified) 1975 Robert Kahn and Vint Cerf test the new TCP/IP protocol between Stanford and University College London 1975 At IBM, John Cocke advocates RISC processor architecture, and begins work on the 801 to implement it 1977 Ronald Rivest, Adi Shamir, and Leonard Adleman develop the public-key encryption system that they call RSA, and announce it via Martin Gardner’s Mathematical Games column in Scientific American 1977 Robert Solovay and Volker Strassen publish an efficient randomized algorithm for primality testing, demonstrating both the feasibility of RSA and the power of randomized algorithm; shortly afterward, Gary Miller and Michael Rabin find a more efficient such algorithm 1977 Steve Jobs and Steve Wozniak release the Apple II 1977 William Kahan puts forward a draft proposal for the IEEE floating-point standard 1977 In Israel, Abraham Lempel and Jacob Ziv propose the data compression algorithm that (after improvements by Terry Welch and others) becomes the basis for PKZIP and most other general-purpose compression software 1978 Intel releases the 8086, the first in the line of x86 processors 1978 Donald Knuth begins developing the TeX computer typesetting system, which will eventually become the lingua franca of science 1979 Dan Bricklin and Bob Frankston release VisiCalc, the first personal spreadsheet program and “killer app” for the Apple II 1980 Duke University graduate students Tom Truscott and Jim Ellis create Usenet 1981 Nintendo achieves its first video game success with Donkey Kong, designed by Shigeru Miyamoto 1981 The IBM PC is released, running Microsoft’s MS-DOS 1981 Richard Feynman points out the exponential difficulty of simulating quantum physics with a conventional computer, and speculates that a quantum-mechanical computer would do better; a few years later; David Deutsch will publish his construction of a universal quantum Turing machine 1982 Work on pseudorandom generators by Manuel Blum, Silvio Micali, Shafi Goldwasser, and Andy Yao begins the modern era of complexity-based cryptography, which will lead over the next decade to notions such as zero-knowledge, interactive proofs, and probabilistically checkable proofs 1982 Sony and Philips commercially release the compact disc 1982 Michael Fischer, Nancy Lynch, and Michael Paterson prove that it’s impossible to reach consensus in an asynchronous distributed system if there’s even a single faulty processor 1983 Bjarne Stroustrup at Bell Labs develops C++, which is to become the dominant object-oriented programming language 1984 With its iconic Super Bowl commercial, Apple announces the Macintosh, the first consumer machine with a mouse/windows interface 1984 Robert Axelrod publishes “The Evolution of Cooperation,” a classic book that uses computer experiments with the Iterated Prisoners’ Dilemma to shed light on human nature 1984 Leslie Valiant at Harvard proposes PAC (Probably Approximately Correct) learning, which becomes the central mathematical framework for machine learning, and helps to explain why Occam’s Razor “works” 1985 Microsoft releases Windows
1985 Richard Stallman publishes his GNU Manifesto, setting out the principles of the free-software movement 1986 Thinking Machines begins shipping the CM-1 Connection Machine, considered the first massively-parallel supercomputer 1988 While a graduate student at Cornell, Robert Morris creates a computer worm that cripples the Internet (though that wasn’t Morris’s intention) 1989 Mike Godwin formulates Godwin’s Law: “As an online discussion grows longer, the probability of a comparison involving Nazis or Hitler approaches 1″ 1990 At CERN in Geneva, Switzerland, Tim Berners-Lee creates the World Wide Web 1990 The IP=PSPACE Theorem, proved by Carsten Lund, Lance Fortnow, Howard Karloff, Noam Nisan, and Adi Shamir, shows the unexpected power of interactive protocols and opens a new era in the theory of computing 1990 The discovery of boosting—a technique for combining the predictions of different learning algorithms—by Michael Kearns, Rob Schapire, and Yoav Freund, starts a revolution in the theory and practice of machine learning 1990 Microsoft releases its first Office application suite, consisting of Word, Excel, and PowerPoint 1991 At Los Alamos National Laboratory, Paul Ginsparg founds the arXiv, ushering in the era of rapid online dissemination of scientific research 1991 The Linux kernel is designed by Finnish student Linus Torvalds 1991 Phil Zimmermann releases Pretty Good Privacy (PGP), which makes “military-grade” public-key encryption easily available. After the Customs Service opens a criminal investigation, Zimmermann becomes an Internet folk hero 1993 A team headed by Marc Andreessen at the University of Illinois Urbana-Champaign releases NCSA Mosaic, the browser credited with popularizing the Web 1993 Joel Furr first uses the word “spam” to mean “excessive multiple postings” (in that case, to Usenet newsgroups) 1993 With 24 satellites in orbit, the Global Positioning System achieves “initial operational capability.” Originally designed by the US Department of Defense for military applications, GPS quickly finds numerous civilian uses including computerized car navigation 1994 Peter Shor proves that a quantum computer, if built, would be able to factor numbers efficiently, launching quantum computing as an active research field 1994 Thomas Nicely discovers the Pentium FDIV bug; the ensuing controversy and costly recall by Intel underscore the need for hardware verification 1995 Pixar releases Toy Story, the first feature film made entirely with computer-generated imagery
1995 Lee Zehrer launches Match.com, the first major online dating service 1995 Amazon.com is launched by Jeff Bezos and sells its first book 1995 The Institute for Genomic Research uses whole-genome shotgun sequencing—a technique dependent on massive computer power—to sequence the genome of the first free-living organism, the bacterium Haemophilus influenzae 1996 Stanford graduate students Larry Page and Sergey Brin begin developing Google 1997 IBM’s Deep Blue computer defeats human world champion Garry Kasparov 1997 Rob “Commander Taco” Malda founds Slashdot, which hosts freewheeling web-based conversations of the sort that would later be commonplace on blogs 1997 NASA’s Sojourner robotic rover moves semi-autonomously across the surface of Mars for 83 days, sending spectacular images back to Earth 1999 Widespread fear of the “Y2K millennium bug” underscores society’s dependence on legacy computer systems. Later, many will argue the fears were overblown 2000 The first major denial-of-service (DoS) attack is launched against CNN, Yahoo, and eBay 2000 Putting an unexpected practical twist on Alan Turing’s ideas from 1950, Manuel Blum, Luis von Ahn, and John Langford at Carnegie Mellon articulate the notion of CAPTCHAs (Completely Automated Public Turing tests to tell Computers and Humans Apart), the challenges—usually involving reading distorted text—that are used by numerous websites to discourage spam-bots 2001 Larry Sanger and Jimmy Wales launch Wikipedia 2001 Bram Cohen develops BitTorrent, the controversial peer-to-peer file sharing protocol now estimated to account for 27-55% of all Internet traffic 2001 In the wake of the 9/11 attacks, news websites continue running smoothly in part because of routing algorithms designed by Akamai Technologies. Meanwhile, former MIT student Danny Lewin, who cofounded Akamai with Professor Tom Leighton, is on American Airlines flight 11 when it crashes into the World Trade Center 2002 At IIT Kanpur, Manindra Agrawal and his students Neeraj Kayal and Nitin Saxena announce a deterministic polynomial-time algorithm for primality testing 2004 Harvard sophomore Mark Zuckerberg launches Thefacebook.com 2005 YouTube is launched, beginning an era of online video-sharing 2007 Apple releases the iPhone 2010 Some of Iran’s centrifuges for uranium enrichment are destroyed by the Stuxnet worm, in the first known large-scale cyberattack to target physical infrastructure 2011 Making essential use of Facebook and Twitter as organizing tools, protesters in Egypt force the resignation of President Hosni Mubarak after 30 years of rule 2011 IBM’s Watson computer defeats all-time human champions Ken Jennings and Brad Rutter on Jeopardy
This entry was posted on Friday, February 11th, 2011 at 8:45 am and is filed under Nerd Interest. You can follow any responses to this entry through the RSS 2.0 feed. You can leave a response, or trackback from your own site.
Personal comment:
Read also Scott Aaronson's post on the MIT blog about the list and the possibility to vote for the top 150 entries.
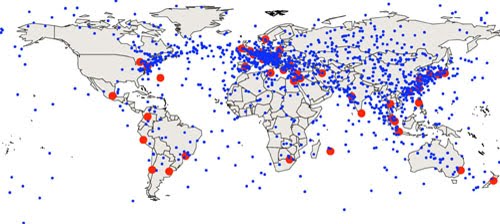
A recent paper published in the Physical Review has some astonishing suggestions for the geographic future of financial markets. Its authors, Alexander Wissner-Grossl and Cameron Freer, discuss the spatial implications of speed-of-light trading. Trades now occur so rapidly, they explain, and in such fantastic quantity, that the speed of light itself presents limits to the efficiency of global computerized trading networks.
These limits are described as "light propagation delays."
[Image: Global map of "optimal intermediate locations between trading centers," based on the earth's geometry and the speed of light, by Alexander Wissner-Grossl and Cameron Freer].
It is thus in traders' direct financial interest, they suggest, to install themselves at specific points on the Earth's surface—a kind of light-speed financial acupuncture—to take advantage both of the planet's geometry and of the networks along which trades are ordered and filled. They conclude that "the construction of relativistic statistical arbitrage trading nodes across the Earth’s surface" is thus economically justified, if not required.
Amazingly, their analysis—seen in the map, above—suggests that many of these financially strategic points are actually out in the middle of nowhere: hundreds of miles offshore in the Indian Ocean, for instance, on the shores of Antarctica, and scattered throughout the South Pacific (though, of course, most of Europe, Japan, and the U.S. Bos-Wash corridor also make the cut).
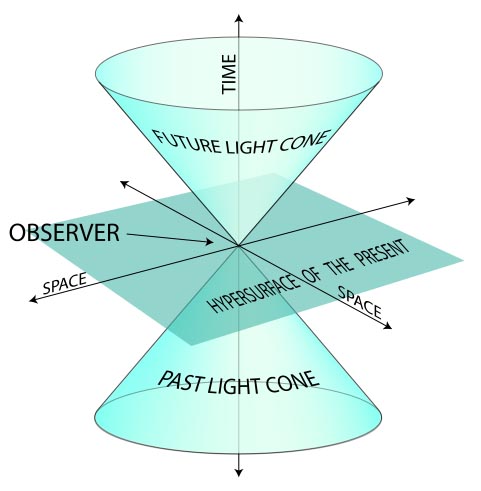
These nodes exist in what the authors refer to as "the past light cones" of distant trading centers—thus the paper's multiple references to relativity. Astonishingly, this thus seems to elide financial trading networks with the laws of physics, implying the eventual emergence of what we might call quantum financial products. Quantum derivatives! (This also seems to push us ever closer to the artificially intelligent financial instruments described in Charles Stross's novel Accelerando). Erwin Schrödinger meets the Dow.
It's financial science fiction: when the dollar value of a given product depends on its position in a planet's light-cone.
[Image: Diagrammatic explanation of a "light cone," courtesy of Wikipedia].
These points scattered along the earth's surface are described as "optimal intermediate locations between trading centers," each site "maximiz[ing] profit potential in a locally auditable manner."
Wissner-Grossl and Freer then suggest that trading centers themselves could be moved to these nodal points: "we show that if such intermediate coordination nodes are themselves promoted to trading centers that can utilize local information, a novel econophysical effect arises wherein the propagation of security pricing information through a chain of such nodes is effectively slowed or stopped." An econophysical effect.
In the end, then, they more or less explicitly argue for the economic viability of building artificial islands and inhabitable seasteads—i.e. the "construction of relativistic statistical arbitrage trading nodes"—out in the middle of the ocean somewhere as a way to profit from speed-of-light trades. Imagine, for a moment, the New York Stock Exchange moving out into the mid-Atlantic, somewhere near the Azores, onto a series of New Babylon-like platforms, run not by human traders but by Watson-esque artificially intelligent supercomputers housed in waterproof tombs, all calculating money at the speed of light.
"In summary," the authors write, "we have demonstrated that light propagation delays present new opportunities for statistical arbitrage at the planetary scale, and have calculated a representative map of locations from which to coordinate such relativistic statistical arbitrage among the world’s major securities exchanges. We furthermore have shown that for chains of trading centers along geodesics, the propagation of tradable information is effectively slowed or stopped by such arbitrage."
Historically, technologies for transportation and communication have resulted in the consolidation of financial markets. For example, in the nineteenth century, more than 200 stock exchanges were formed in the United States, but most were eliminated as the telegraph spread. The growth of electronic markets has led to further consolidation in recent years. Although there are advantages to centralization for many types of transactions, we have described a type of arbitrage that is just beginning to become relevant, and for which the trend is, surprisingly, in the direction of decentralization. In fact, our calculations suggest that this type of arbitrage may already be technologically feasible for the most distant pairs of exchanges, and may soon be feasible at the fastest relevant time scales for closer pairs.
Our results are both scientifically relevant because they identify an econophysical mechanism by which the propagation of tradable information can be slowed or stopped, and technologically significant, because they motivate the construction of relativistic statistical arbitrage trading nodes across the Earth’s surface.
As City of Sound writes, the film suggests that the "grain" of experimental future media—or, rather, the experimental reuse of existing media—will always start off "slightly awkward, incomplete, jittery, fizzing in and out of focus. And yet magical. Coverage is patchy, positioning vague, interaction is compromised yet the capabilities of people, buildings and cities are extended nonetheless."
This particular effect—caused by images that have been animated on the screen of a moving iPad that is then photographed in timelapse—could easily be scaled up. Everything from LEDs on the bottoms of glass-walled elevators to special lights in passing cars and buses could be given three-dimensional content: unexpected forms of content projected into the urban air and only detectable, or legible, on a different temporal register.
The optical future of architectural ornament: light with content.
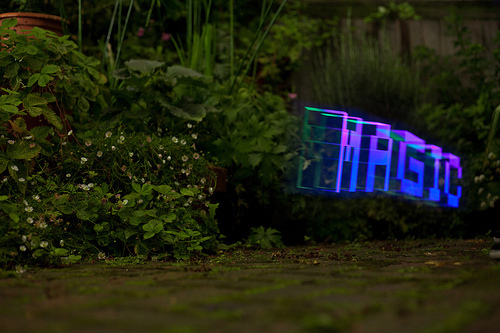
That is, you get home with your digital camera and you click back through to see what you've photographed—and there are words, shapes, and objects hovering there in the street, or inside the buildings you once stood within, visual data only revealed through long-exposures.
The possibilities for creating 3D information displays hidden in a kind of acute angle to the present moment—literally on display right in front of you but only visible later, when filtered through a timestretched medium—are mindboggling. It's like the present moment is coinciding with a much larger holograph—the present moment as an airplane flying through a cloud.
To say that this exact technique will soon be popping up as a special effect in feature films is, I think, an understatement. It's the new bullet time, perhaps: little screens attached to automated tracks, whirling around a film set, spinning words, ghosts, and images through space.
Personal comment:
This project by Berg has been published widely recently. I just like the urban and time twist Geoff Manaugh is bringing into the loop.
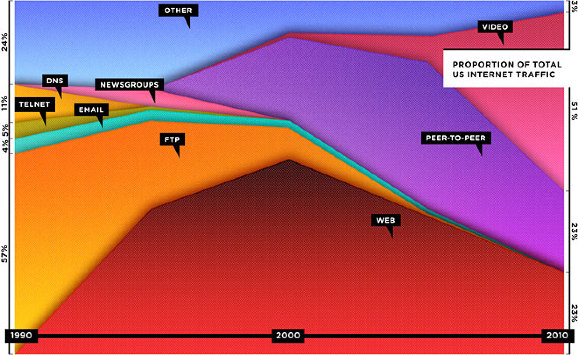
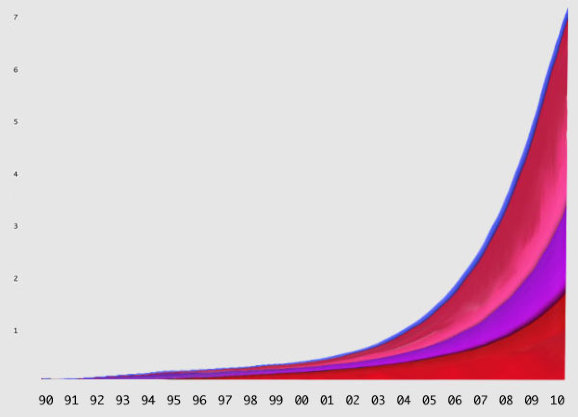
If you went with total useage, the graph might look like this:
"In fact," Beschizza writes, "between 1995 and 2006, the total amount of web traffic went from about 10 terabytes a month to 1,000,000 terabytes (or 1 exabyte). According to Cisco, the same source Wired used for its projections, total internet traffic rose then from about 1 exabyte to 7 exabytes between 2005 and 2010."
Now, using actual total traffic as the vertical axis, Beschizza reimagines the graph like this:
Does that look like "death" to you?
Personal comment:
Besides the point about web's death (we are speaking here about the "death" of a web of pages, but the increase in the spread of Internet usage) that was made by Wired as an editorial ad. and (apparently rightly) disputed here by Rob Beschizza, it is also interesting to see how far an information graphic can deceive its readers depending on what value you put on which axis...
It's an obvious point, I know... but nonetheless what we do with data and how we visuaklie it are becoming so important nowadays that we have to be really aware of that and don't take any fancy data graph for granted.
Interactive tool layering climate data over Google Earth maps shows the impact of an average global temperature rise of 4C
A new interactive Google Earth map was developed using peer-reviewed science from the Met Office Hadley Centre and other leading impact scientists. Photograph: earth.google.co.uk
Think it's hot this summer? Wait until you see Google's simulation of a world with an average global temperature rise of 4C.
Playing with the layer is surprisingly addictive, mainly thanks to Google Earth's draggable interface. Unlike the static map of last year, it also has the bonus of showing more obviously how temperature rises will differ drastically around the world. The poles glow a red (a potential rise of around 10C) while most of northern Europe escapes with light orange 2-3C rises. Other hotspots, such as Alaska, the Amazon and central Asia, also stand out.
Neatly, you can turn different climate "impacts" on and off. If you just want to see which regions will be worst affected by sea level rises - such as the UK and Netherlands as well as low-lying island states - you can. One limitation is that you have to zoom out to continental level to see the layer: if you're zoomed on your street, you can't see it.
Climate change minister Greg Barker launched the map today alongside the government's chief scientist, Prof John Beddington. Barker said: "This map reinforces our determination to act against dangerous man-made climate change. We know the stakes are high and that's why we want to help secure an ambitious global climate change deal."
An interface and layer (Google Earth) to monitor the evolution of the predictions about climate. Should be updated as knowledge evolves.
Which brings a thought to our recent Arctic Opening project as it shoes that the arctic region will be dramatically hit by the rises of temperatures on the Globe.
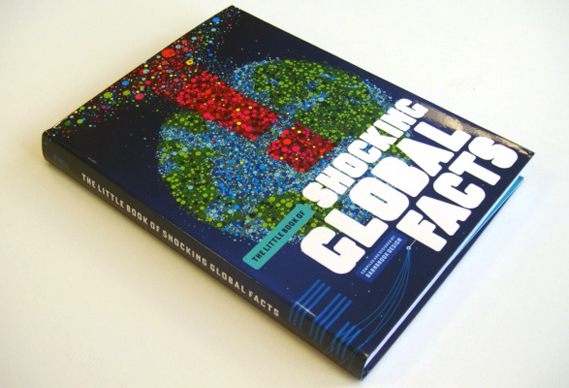
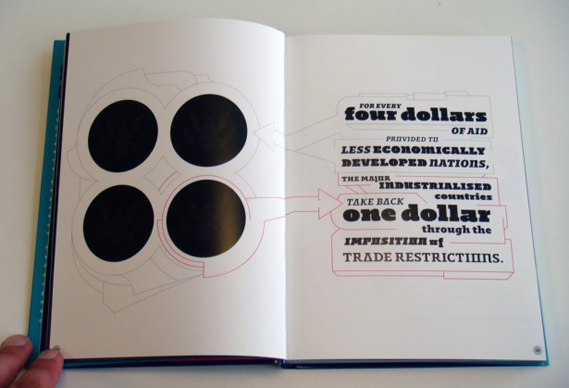
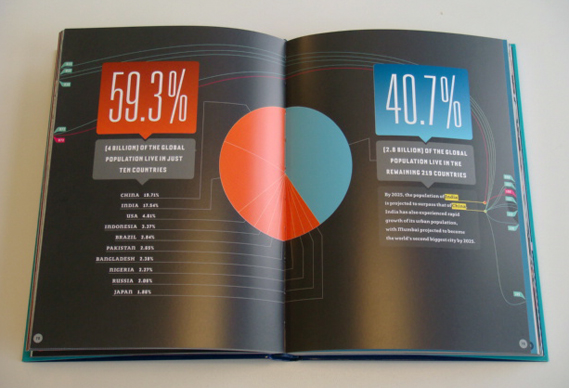
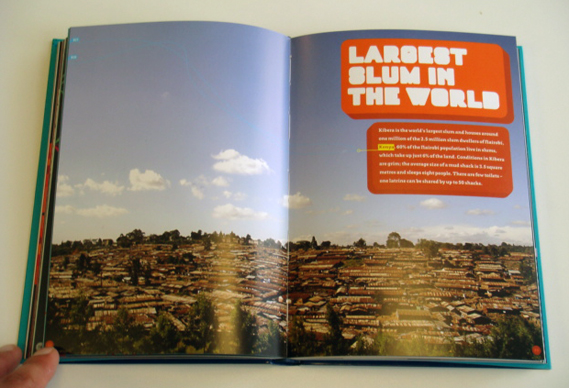
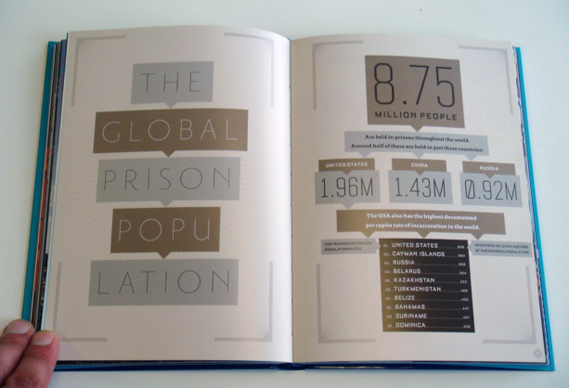
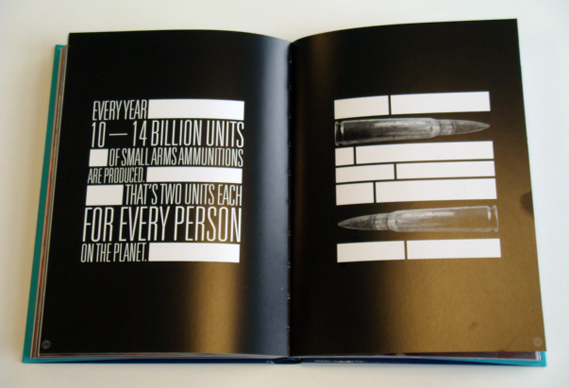
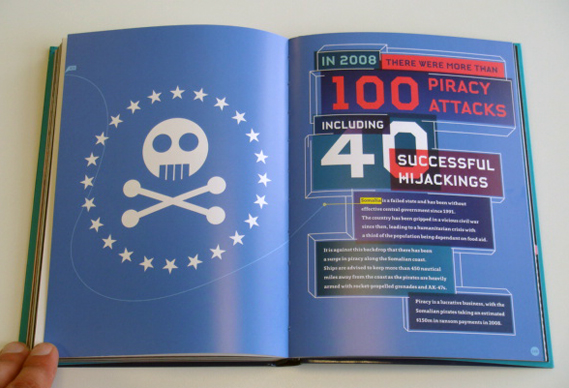
Barnbrook has compiled and designed a 192 page book which combines graphic imagery with hundreds of shocking global facts. Did you know, for example, that 2.6 billion people do not have basic sanitation, or that life expectancy in Swaziland is just 32 years, or that there are nearly 2 million inmates currently housed in US prisons?
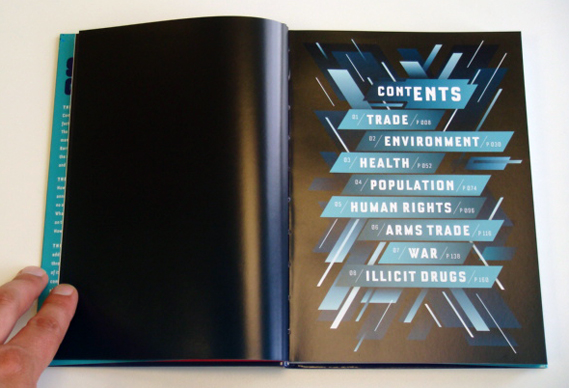
The various facts collected in The Little Book of Shocking Global Facts (published by Fiell, £8.95) are arranged into chapters (see two images down for the contents page) and no two spreads share the same design or layout. Essentially the book aims to highlight what the authors see as the dangers of unchecked globalisation.
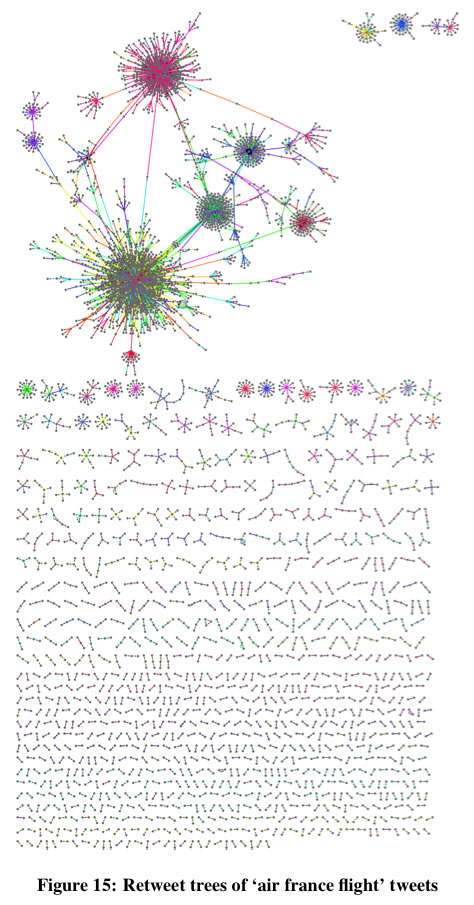
An unprecedented analysis reveals that the micro-blogging service is remarkably effective at spreading "important" information.
By Christopher Mims
It's basically impossible for a journalist who relies on Twitter to find stories, stalk editors, rack up "whuffie" and beef with rap stars to be objective about the service.
Fortunately, I don't have to be, because four researchers from the Department of Computer Science at the Korea Advanced Institute of Science and Technology have performed a multi-part analysis of Twitter. They conclude that it's a surprisingly interconnected network and an effective way to filter quality information.
In a move unprecedented in the history of academic research on Demi Moore's chosen medium for feuding with Kim Kardashian, Kwak et al. built an array of 20 PCs to slurp down the entire contents of Twitter over the course of a month. If you were on Twitter in July 2009, you participated in their experiment.
This "retweet tree analysis" shows instances of retweeting. When a message is retweeted just a few times it reaches a huge number of users. Credit: Kwak et al.
Four Degrees of Separation
The ideas behind Stanley Milgram's original "six degrees of separation" experiment, which suggested that any two people on earth could be connected by at most six hops from one acquaintance to the next, have been widely applied to online social networks.
On the MSN messenger network of 180 million users, for example, the median degree of separation is 6. On Twitter, Kwak et al. hypothesized that because only 22.1% of links are reciprocal (that is, I follow you, and you follow me as well) the number of degrees separating users would be longer. In fact, the average path length on Twitter is 4.12.
What's more, because 94% of the users on Twitter are fewer than five degrees of separation from one another, it's likely that the distance between any random Joe or Jane and say, Bill Gates, is even shorter on Twitter than in real life.
Information as Outbreak
"...No matter how many followers a user has, the tweet is likely to reach [an audience of a certain size] once the user's tweet starts spreading via retweets," says Kwak et al. "That is, the mechanism of retweet has given every user the power to spread information broadly [...] Individual users have the power to dictate which information is important and should spread by the form of retweet [...] In a way we are witnessing the emergence of collective intelligence."
If this reminds of you early 90's hyperbole about the then-new world wide web, it should! Back then the web was a raucous, disorganized, largely volunteer-led effort full of surprisingly informative Geocities pages and equally uninformative corporate websites.
These days we have to contend with the creeping power of what can only notionally be defined as media "content"--produced purely to appear at the top of search results. But it appears that the (so far) still entirely human-filtered paradise of Twitter may come to the rescue. Owing to the short path length between any two users, news travels fast in the tweet-o-sphere.
Earlier work suggested that the best way to get noticed on Twitter was to tweet at certain times of day, and Kwak et al.'s paper sheds some light on why this is the case: "Half of retweeting occurs within an hour, and 75% under a day." And it's those initial re-tweets that make all the difference: "What is interesting is from the second hop and on is that the retweets two hops or more away from the source are much more responsive and basically occur back to back up to 5 hops away."
There Are a Lot of Lonely People on Twitter
Clashing with the service's interconnectivity, Kwak et al.'s analysis also suggests that there are a lot of lonely people on Twitter, and not just the ones who are tweeting angry political screeds at 8 pm on a Saturday night. "67.6% of users are not followed by any of their followings in Twitter," they report. "We conjecture that for these users Twitter is rather a source of information than a social networking site."
Another possibility, left unexplored by Kwak and his colleagues, is simply that on Twitter, like real life, some people are much more popular than others.
Aside from its monkey + keyboard simplicity, the fact that links on Twitter do not have to be reciprocal may be its ultimate genius. To that end, I urge all of you to follow Technology Review on Twitter. I must warn you that, as an enormously influential inanimate object, it has no empathy or conscience, so don't take it personally when it doesn't follow you back.
Personal comment:
And I quite like the following remark about this blog post, to someone expressing doubts about Twitter as an information network (to which I partly agree) :
"Instead of a social network, try thinking of Twitter as a distributed 140 char sensor network and you might have an easier time accepting it. Seems to me it's mostly bitter or unimaginative people who are riding the Twitter anti-hype. "
I think this idea of Twitter as a sort of analog sensors (the people) network about anything is quite interesting. It goes in the direction of human-computer ecosystem (a sort of different Machanical Turk?).
This blog is the survey website of fabric | ch - studio for architecture, interaction and research.
We curate and reblog articles, researches, writings, exhibitions and projects that we notice and find interesting during our everyday practice and readings.
Most articles concern the intertwined fields of architecture, territory, art, interaction design, thinking and science. From time to time, we also publish documentation about our own work and research, immersed among these related resources and inspirations.
This website is used by fabric | ch as archive, references and resources. It is shared with all those interested in the same topics as we are, in the hope that they will also find valuable references and content in it.


 [Image: Diagrammatic explanation of a "light cone," courtesy of Wikipedia].
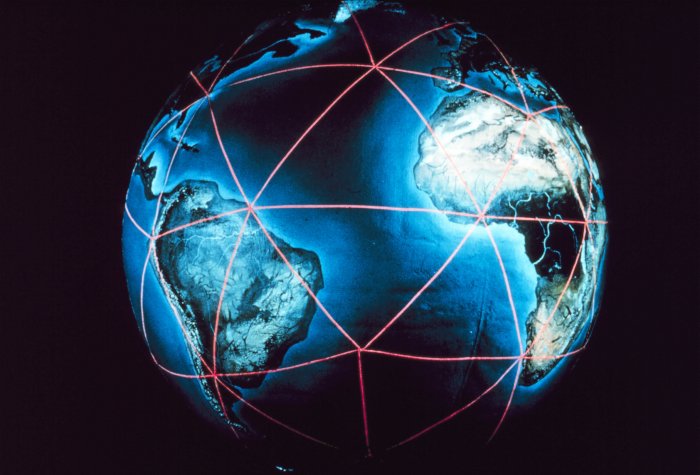 [Image: An otherwise unrelated image from NOAA featuring a geodetic satellite triangulation network].
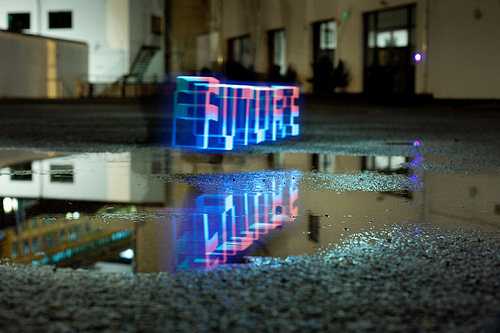
 [Images: From Making Future Magic by BERG/Dentsu London, courtesy of BERG Studio].
 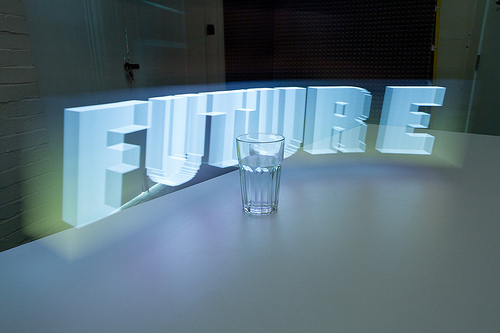 [Image: From Making Future Magic by BERG/Dentsu London, courtesy of BERG Studio].
 [Image: From Making Future Magic by BERG/Dentsu London, courtesy of BERG Studio].
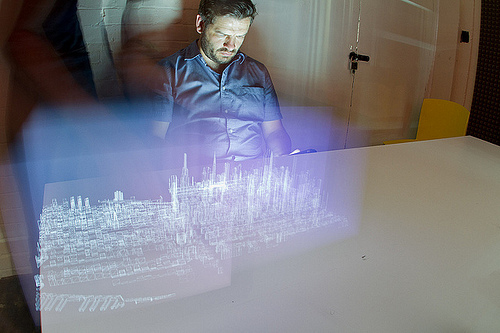 [Image: From Making Future Magic by BERG/Dentsu London, courtesy of BERG Studio].